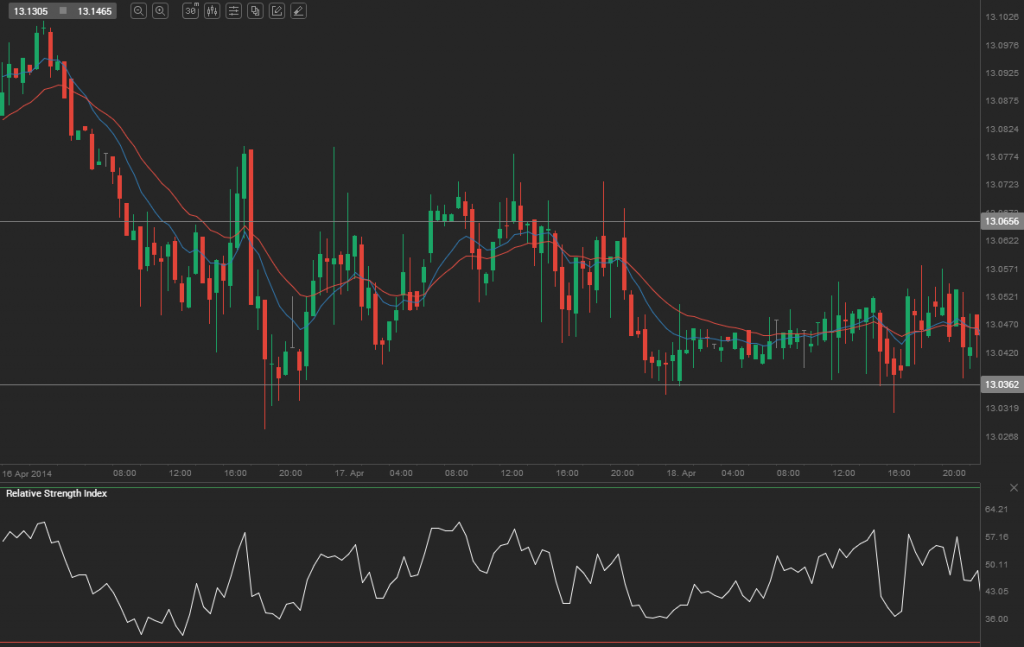
During Fridays trading session USD/MXN traded within the range of 13.0343-13.0635 and closed at 13.0519.
Fundamental view
The Conference Board (CB) Leading Index will probably rise by 0.7% in April, following a 0.5% gain in the previous month.
The index of leading indicators is a composite index and is based on 10 economic indicators. It is regarded as a key element in the analytical system, which is designed to provide signals for peaks and troughs in the business cycle. Leading, coincident and lagging indicators are expressed as a weighted average of several indicators of the same kind. They are designed to summarize and reveal common points of divergence of the market model, transform data in a clear and persuasive form compared to individual components, especially as they are adjusted to remove volatility of individual components. Historically, the cyclical divergence points in the index of leading indicators appear before this happens in overall economic activity. Cyclical divergence points in the lagging economic index occur after the changes appeared in the overall economic activity. The index of leading indicators include the following indicators: average hourly wages, production, average weekly data on requests for payment of redundancy benefits, consumer goods and materials supply index, production, new orders in the manufacturing sector, goods – excluding defense, building permits, housing starts, stock prices, 500 common stocks, money supply M2, base rate bonds with a term of 10 years, except those from government stocks and index of consumer expectations. The index measures the percentage change from the previous month.
The Conference Board is to release an official report at 15:00 GMT on Monday. A higher-than-expected reading will support greenbacks demand.
Technical view
According to Binary Tribune’s daily analysis, in case USD/MXN manages to breach the first resistance level at 13.0656, it will probably continue up to test 13.0791. In case the second key resistance is broken, the pair will probably attempt to advance to 13.0947.
If USD/MXN manages to breach the first key support at 13.0362, it will probably continue to slide and test 13.0207. With this second key support broken, the movement to the downside will probably continue to 13.0071.


