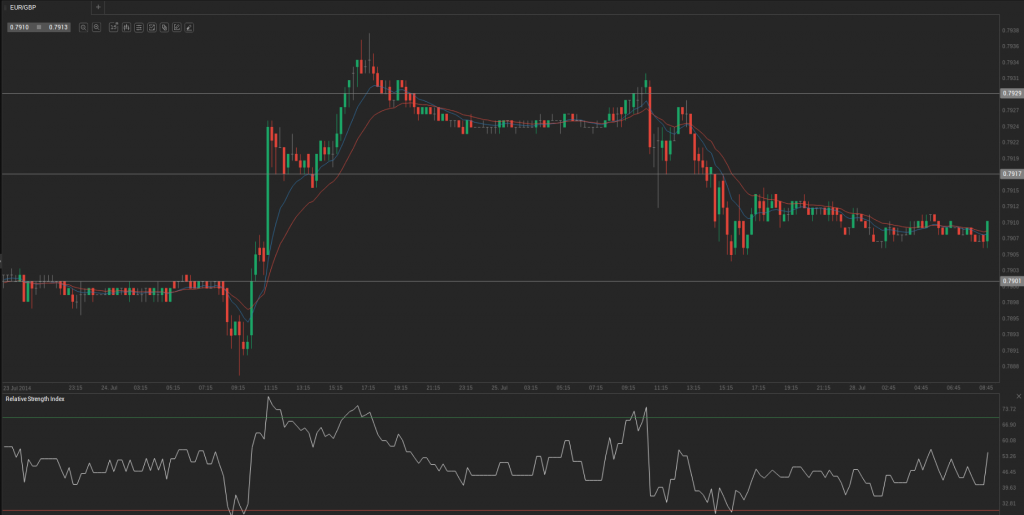
During Friday’s trading session EUR/GBP traded within the range of 0.7906-0.7934 and closed at 0.7912.
At 6:23 GMT today EUR/GBP was losing 0.05% for the day to trade at 0.7908. The pair touched a daily high at 0.7907 at 6:15 GMT. EUR/GBP touched 0.7874 on June 23rd, the pair’s weakest since August 22nd 2012.
Fundamental view
Business Confidence in Italy, the third-largest economy in the Euro zone, probably improved to 100.9 this month, from 100.0 in June, that was the highest since June 2011.
The Institute for Economic Studies and Analyses (ISAE) explores the cyclical development of the manufacturing sector in Italy by studying 4 000 Italian business companies. The index mainly considers the current trend (domestic and international) in orders, production and stocks. It also takes into account the short-term forecasts on orders, production and prices, as well as the general economic situation. Respondents also draw up an estimate of their planned costs and investments for the current year, the next year and the year after next year, making evaluation of investment rates for the same years.
The Istituto di Studi e Analisi Economica (ISAE) will release an official report at 8:00 GMT. Higher than expected reading will certainly heighten demand for the 18-nation common currency.
Technical view
According to Binary Tribune’s daily analysis, the central pivot point for the pair is at 0.7917. In case EUR/GBP manages to breach the first resistance level at 0.7929, it will probably continue up to test 0.7945. In case the second key resistance is broken, the pair will probably attempt to advance to 0.7957.
If EUR/GBP manages to breach the first key support at 0.7901, it will probably continue to slide and test 0.7889. With this second key support broken, the movement to the downside will probably continue to 0.7873.
In weekly terms, the central pivot point is at 0.7908. The three key resistance levels are as follows: R1 – 0.7943, R2 – 0.7973, R3 – 0.8008. The three key support levels are: S1 – 0.7878, S2 – 0.7843, S3 – 0.7813.


