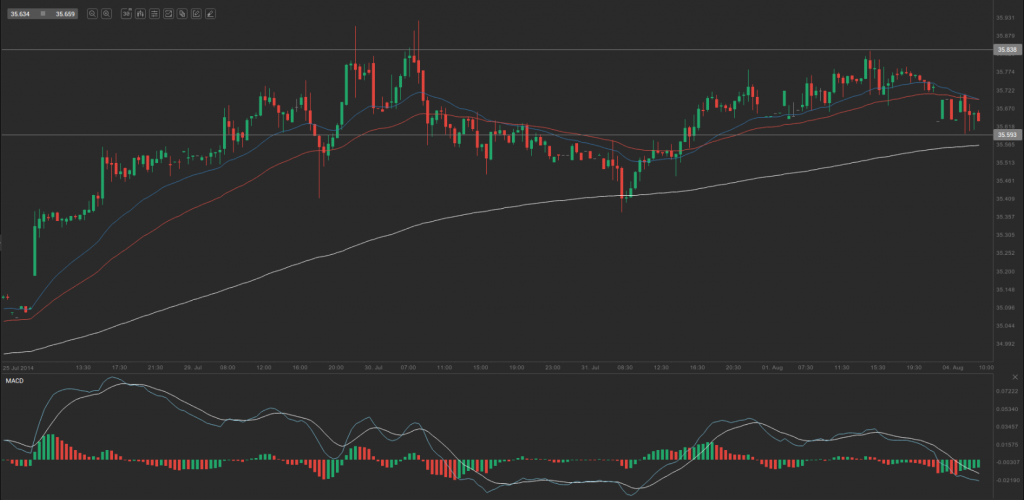
Friday’s trade saw USD/RUB within the range of 35.678-35.843. The pair closed at 35.753, gaining 0.17% on a daily basis.
At 7:12 GMT today USD/RUB was down 35.662 0.25% for the day to trade at 35.662. The pair broke the first key daily support and touched a daily low at 35.620 at 6:40 GMT.
Fundamental view
Russian Federation
Russia’s annualized index of consumer prices (CPI) probably remained unchanged in July, dipping to 7.79% from 7.80% in June. In monthly terms, the CPI probably rose 0.72% in July, according to market expectations, following a 0.6% surge in June. The index measures the change in price levels of a basket of goods and services from consumer’s perspective and also reflects purchasing trends. Annualized consumer inflation in the country has been rising since January. This was the reason behind policy decision by the Central Bank of Russia – to raise its benchmark interest rate to 8.0% on July 25th from the prior level of 7.5%. In case the CPI continued to climb, this might urge the central bank to take further actions, while a potential interest rate hike would support the ruble. The Federal State Statistics Service is scheduled to release the official CPI report at 12:00 GMT.
Technical view
According to Binary Tribune’s daily analysis, the central pivot point for the pair is at 35.758. In case USD/RUB manages to breach the first resistance level at 35.838, it will probably continue up to test 35.923. In case the second key resistance is broken, the pair will probably attempt to advance to 36.003.
If USD/RUB manages to breach the first key support at 35.673, it will probably continue to slide and test 35.593. With this second key support broken, the movement to the downside will probably continue to 35.508.
The mid-Pivot levels for today are as follows: M1 – 35.551, M2 – 35.633, M3 – 35.716, M4 – 35.798, M5 – 35.881, M6 – 35.963.
In weekly terms, the central pivot point is at 35.593. The three key resistance levels are as follows: R1 – 36.085, R2 – 36.418, R3 – 36.910. The three key support levels are: S1 – 35.260, S2 – 34.678, S3 – 34.435.


