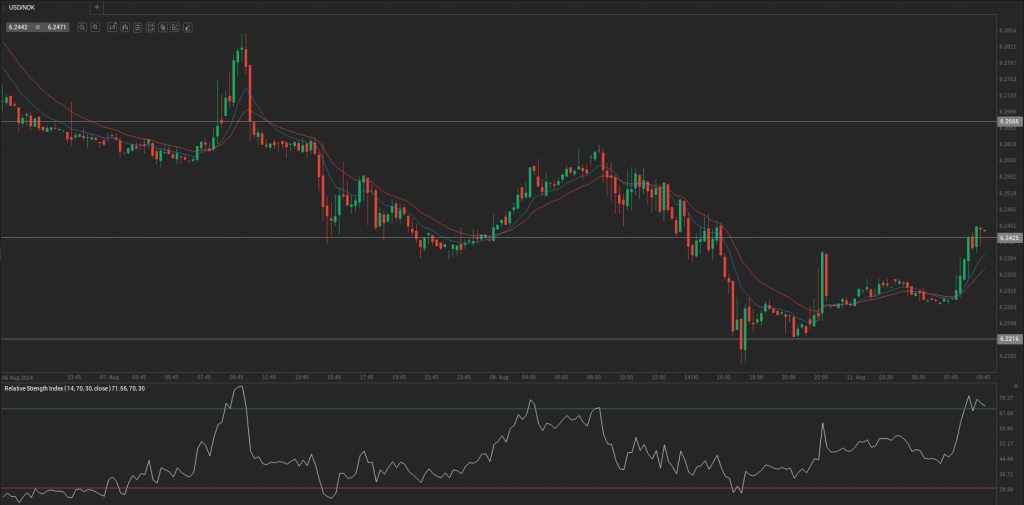
During Friday’s trading session USD/NOK traded within the range of 6.2188-6.2637 and closed at 6.2454, losing 0.06% for the day, extending the weekly loss to 0.36%.
At 7:07 GMT today USD/NOK was losing 0.04% for the day to trade at 6.2428. The pair touched a daily low at 6.2313 at 00:00 GMT.
Fundamental view
Norway’s annualized index of consumer prices (CPI) probably rose 1.5% in July, following a 1.9% gain in the previous month. It reflects the change in the general level of prices of over 650 goods and services, which the population acquires, uses or pays for consumption. In case the CPI accelerated more than expected, this would bolster demand for the krone.
Nation’s annualized core CPI (CPI-ATE) probably jumped 1.9% in July, after rising 2.4% during the prior month. This indicator is comprised by two main components – CPI-AE, which excludes energy costs and prices of raw materials, and CPI-AT, which is based on real current prices adjusted for taxes. CPI-ATE is the indicator, used by Norges Bank in order to set its interest rate policy. A higher than expected core CPI would support the national currency, as this boosts the case for a rate hike.
Statistics Norway is to release the official report on consumer inflation at 8:00 GMT.
Technical view
According to Binary Tribune’s daily analysis, the central pivot point for the pair is at 6.2425. In case USD/NOK manages to breach the first resistance level at 6.2666, it will probably continue up to test 6.2875. In case the second key resistance is broken, the pair will probably attempt to advance to 6.3114.
If USD/NOK manages to breach the first key support at 6.2216, it will probably continue to slide and test 6.1977. With this second key support broken, the movement to the downside will probably continue to 6.1767.
In weekly terms, the central pivot point is at 6.2571. The three key resistance levels are as follows: R1 – 6.2953, R2 – 6.3453, R3 – 6.3835. The three key support levels are: S1 – 6.2071, S2 – 6.1689, S3 – 6.1189.


