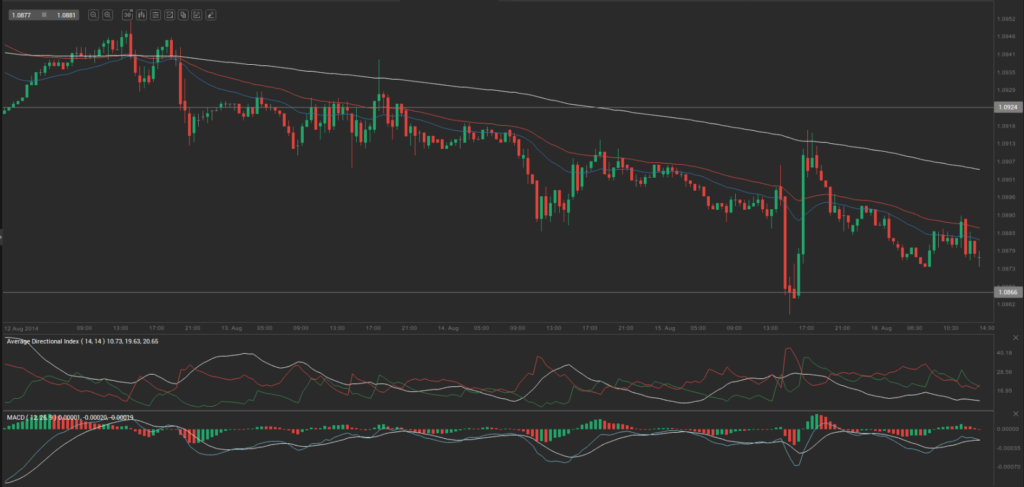
Yesterday’s trade saw USD/CAD within the range of 1.0860-1.0918. The pair closed at 1.0898, losing 0.08% on a daily basis.
At 11:42 GMT today USD/CAD was down 0.20% for the day to trade at 1.0876, which is also the current daily low.
Fundamental view
United States
The National Association of Home Builders (NAHB) Housing Market Index probably remained unchanged at a reading of 53.0 in August. It is based on a monthly survey in regard to current home sales and expected sales in the coming six months. Values above the key level of 50.0 indicate that housing market conditions are good. Therefore, higher than projected readings would provide support to the US dollar. The official data is scheduled for release at 14:00 GMT.
Canada
Foreign portfolio investment in Canadian securities probably shrank to 14.68 billion CAD in June, according to the median forecast by experts, from 21.43 billion CAD in May. This indicator reflects the flow of incoming investments in the local stock, bond and money markets. An increasing flow of foreign investments is usually related with a positive economic outlook for the country being invested in. This usually increases demand for its currency, therefore, in case portfolio investment in Canadian securities expanded more than anticipated, Canadian dollar would receive support. The official data by Statistics Canada is due out at 12:30 GMT.
Technical view
According to Binary Tribune’s daily analysis, the central pivot point for the pair is at 1.0892. In case USD/CAD manages to breach the first resistance level at 1.0924, it will probably continue up to test 1.0950. In case the second key resistance is broken, the pair will probably attempt to advance to 1.0982.
If USD/CAD manages to breach the first key support at 1.0866, it will probably continue to slide and test 1.0834. With this second key support broken, the movement to the downside will probably continue to 1.0808.
The mid-Pivot levels for today are as follows: M1 – 1.0821, M2 – 1.0850, M3 – 1.0879, M4 – 1.0908, M5 – 1.0937, M6 – 1.0966.
In weekly terms, the central pivot point is at 1.0899. The three key resistance levels are as follows: R1 – 1.0939, R2 – 1.0979, R3 – 1.1019. The three key support levels are: S1 – 1.0859, S2 – 1.0819, S3 – 1.0779.


