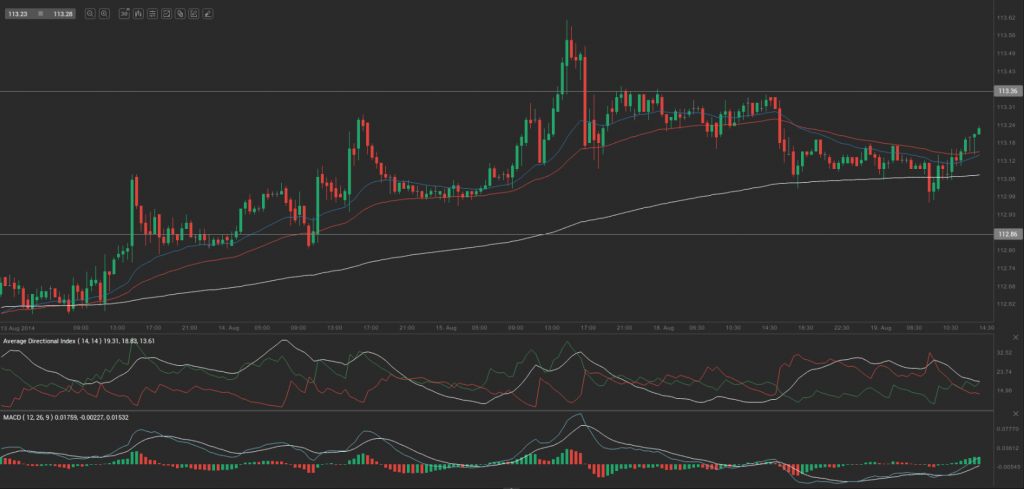
Yesterday’s trade saw CHF/JPY within the range of 113.05-113.39. The pair closed at 113.17, losing 0.15% on a daily basis.
At 11:36 GMT today CHF/JPY was up 0.08% for the day to trade at 113.24. The pair touched a daily low at 113.25 at 11:30 GMT.
Fundamental view
Japan
The deficit on Japanese seasonally adjusted trade balance probably narrowed to 0.770 trillion JPY during July from a deficit of 1.081 trillion JPY, registered in June. The trade balance, as an indicator, measures the difference in value between country’s exported and imported goods and services during the reported period. A positive balance signifies a trade surplus and a negative balance signifies a trade deficit. The balance of trade reflects the net export of goods and services, or one of the components to form country’s Gross Domestic Product.
Annualized exports probably rose 3.8% last month, following a drop of 2.0% in June. Annualized imports probably decreased 1.7% in July, after a surge of 8.4% in the preceding month. Generally, exports reflect economic growth, while imports indicate domestic demand. In case the trade balance deficit contracted more than anticipated, this would provide support to the yen. The Ministry of Finance will release the official numbers at 23:50 GMT.
On August 8th Bank of Japan revised down its projections regarding nations exports and manufacturing activity.
Technical view
According to Binary Tribune’s daily analysis, the central pivot point for the pair is at 113.20. In case CHF/JPY manages to breach the first resistance level at 113.36, it will probably continue up to test 113.54. In case the second key resistance is broken, the pair will probably attempt to advance to 113.70.
If CHF/JPY manages to breach the first key support at 113.02, it will probably continue to slide and test 112.86. With this second key support broken, the movement to the downside will probably continue to 112.68.
The mid-Pivot levels for today are as follows: M1 – 112.77, M2 – 112.94, M3 – 113.11, M4 – 113.28, M5 – 113.45, M6 – 113.62.
In weekly terms, the central pivot point is at 113.22. The three key resistance levels are as follows: R1 – 113.83, R2 – 114.23, R3 – 114.84. The three key support levels are: S1 – 112.82, S2 – 112.21, S3 – 111.81.


