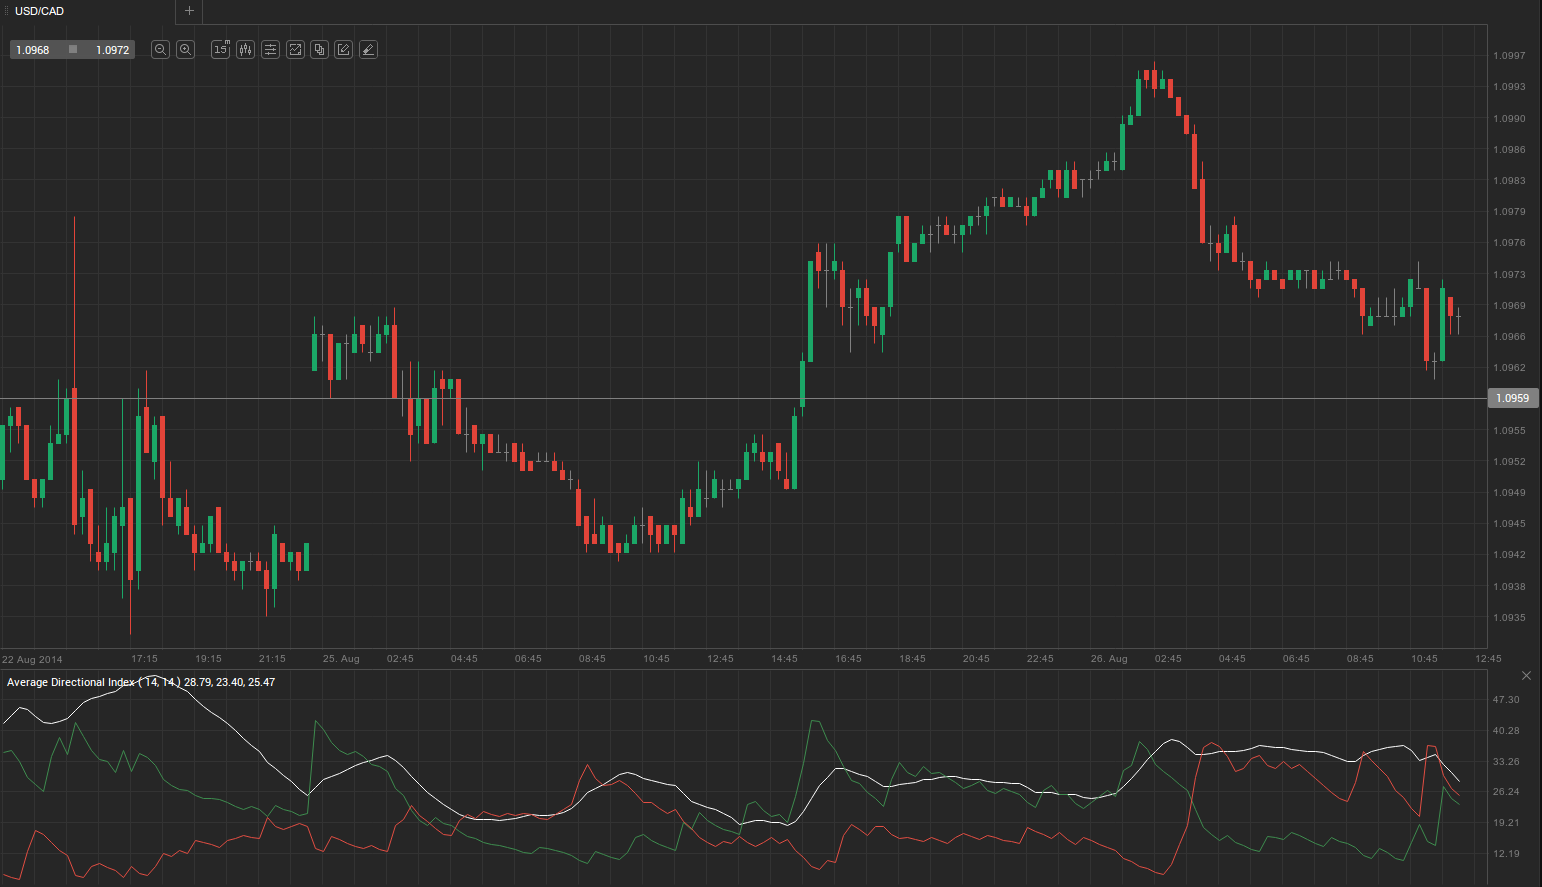
During yesterday’s trading session USD/CAD traded within the range of 1.0998 – 1.0943 and closed at 1.0995, up 0.24% on the day.
At 9:22 GMT today USD/CAD was down 0.14% for the day to trade at 1.0969. The pair touched a daily low at 1.0963 at 8:33 GMT, while days high stood at 1.0998.
Fundamental view
United States
Durable goods orders in the United States probably rose by 7.5% in July, according to the median forecast by experts, following a revised 1.7% jump during the prior month.
Durable goods orders, as an indicator, gauge the strength of US manufacturing sector and represent a major portion of nation’s Factory Orders. This is a closely watched report on manufacturing activity, because durable goods are the first type of goods to be affected by an economic downturn or upturn.
Durable goods are designed to last three or more years and encompass aircraft, automobiles and buses, cranes, machine parts, appliances etc. More than 85 industries are represented in the sample, which covers the entire United States. The logic behind this indicator is that consumers need to be very optimistic in order to buy an automobile in comparison with, for example, first necessities such as food or clothing. Therefore, durable goods are among the first goods, which a consumer may abstain from purchasing, in case overall economic activity begins to contract. The same is valid for company purchases. During a recession, an airliner is less likely to purchase new planes and as factory output contracts, it is less likely to purchase new machines.
Durable goods orders, which exclude transportation, likely rose by 0.5% in July, following the previous month’s upward-revised 1.9% jump. Large ticket orders, such as automobiles for civil use or aircraft, are not present in the calculation due to their volatility. This way the index provides a more reliable information in regard to orders of durable goods.
In case orders increased at a faster pace than projected, this would have a bullish effect on the greenback. US Census Bureau is scheduled to release the official numbers at 12:30 GMT.
Later in the day Standard & Poor’s will release its S&P/Case-Shiller House Price Index, which measures the change in prices of single-family homes in 20 metropolitan areas across the US. The report serves as a gauge of the US housing market’s health. According to preliminary estimates, the respective homes’ price probably rose by 1.0% on a monthly basis in June, compared to 1.1% a month earlier, while marking an 8.4% jump on an annual basis, down from the previous period’s 9.3% rise.
Also due on Tuesday, at 14:00 GMT, is the Conference Board’s August US consumer confidence index. According to preliminary estimates, CB will report that consumer confidence fell in August, with its index dropping to 89.0 from 90.9 in July. The report measures the level of individuals’ confidence in the US economic activity. It is considered as a leading indicator as it gives an early insight into consumer spending, which accounts for most of GDP. Thus, higher consumer confidence is generally seen as bullish for the US dollar, while worsening sentiment is regarded as bearish.
Canada
Statistics Canada is due to release its Corporate Profits report at 12:30 GMT. The indicator measures the change in corporations total net profit. The data is released quarterly. Overall higher corporate profits suggest the economy is generally faring well, which raises interest toward the national currency. Thus, improving and better-than-expected readings should be considered as bullish for the Canadian dollar, and vice versa. Corporate profits were up 7.4% in the preceding quarter.
Technical view
According to Binary Tribune’s daily analysis, the central pivot point for the pair is at 1.0979. In case USD/CAD manages to breach the first resistance level at 1.1014, it will probably continue up to test 1.1034. In case the second key resistance is broken, the pair will probably attempt to advance to 1.1069.
If USD/CAD manages to breach the first key support at 1.0959, it will probably continue to slide and test 1.0924. With this second key support broken, movement to the downside will probably continue to 1.0904.
The mid-Pivot levels for today are as follows: M1 – 1.0914, M2 – 1.0942, M3 – 1.0969, M4 – 1.0997, M5 – 1.1024, M6 – 1.1052.
In weekly terms, the central pivot point is at 1.0936. The three key resistance levels are as follows: R1 – 1.0995, R2 – 1.1046, R3 – 1.1105. The three key support levels are: S1 – 1.0885, S2 – 1.0826, S3 – 1.0775.


