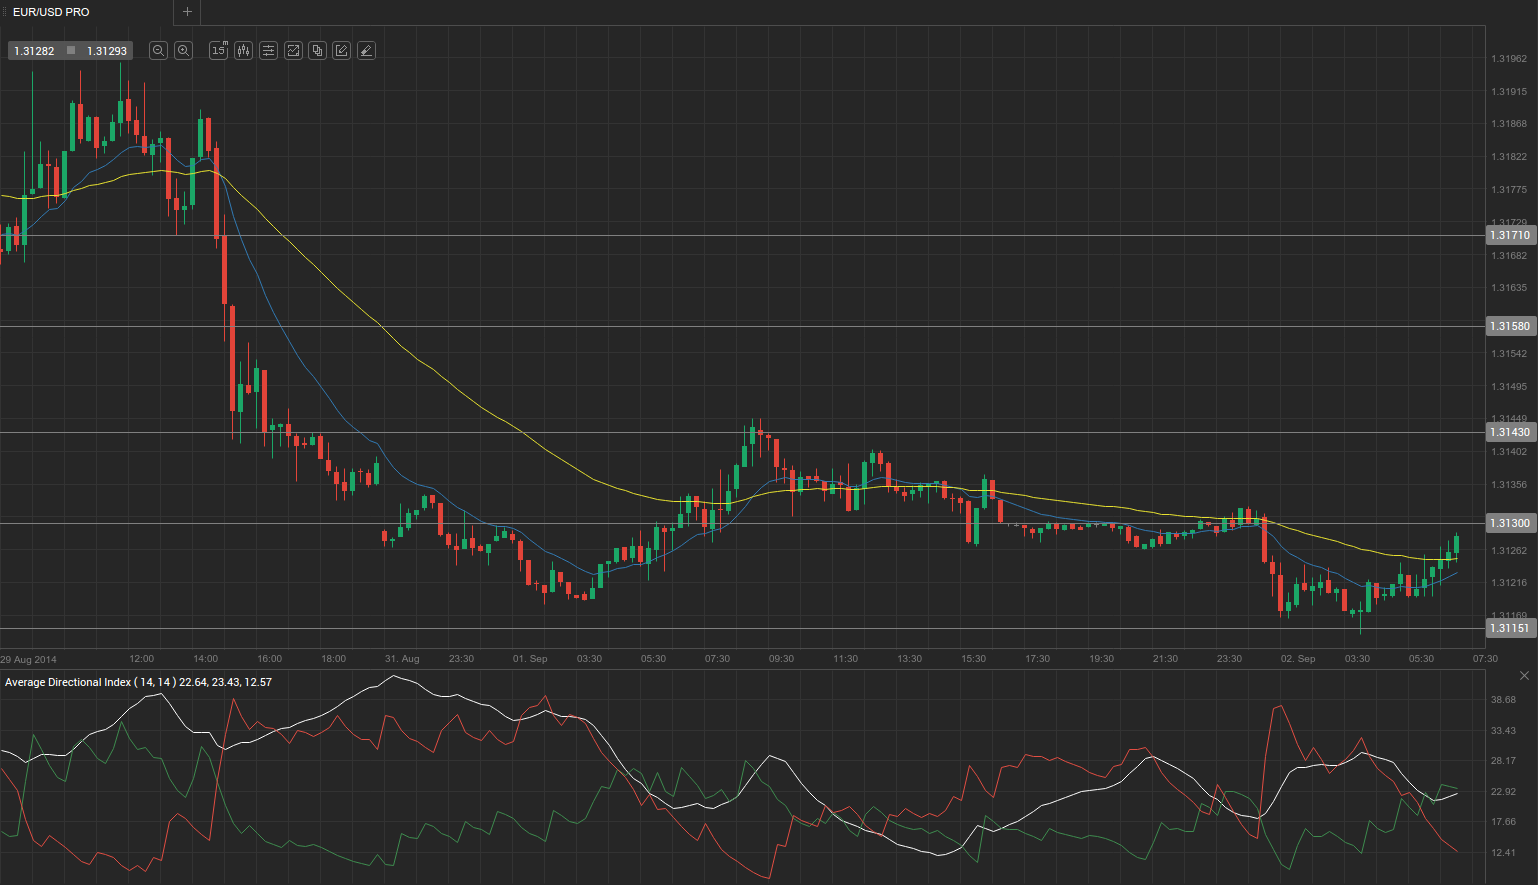
Monday’s trading session saw EUR/USD hold in the range of 1.3145-1.3117 and closed mostly unchanged at 1.3128. The euro fell through the past seven weeks, its longest losing stretch since December 1999.
At 7:12 GMT today EUR/USD was up 0.06% for the day to trade at 1.3137. The pair slid to a daily low of 1.3115, the lowest since September 6th, while day’s high stood at 1.3137.
Fundamental view
Spain’s Ministerio de Empleo y Seguridad Social (Ministry of Labor and Social Security) reported today that the number of unemployed people during August rose by 8 100 compared to a decline of 29 800 in July, outperforming projections to have jumped by 26 000.
Spain’s unemployment change is considered as a leading indicator as it gives a month-on-month insight into Spain’s labor market. A healthy labor market boosts consumer confidence, which has a positive effect on consumer spending and thus bolsters economic activity. Therefore, rising or higher-than-expected values are generally seen as bearish for the euro, and vice versa.
At 09:00 GMT, Eurostat will report on the Eurozone’s producer inflation in July. According to preliminary estimates, producer prices probably fell by 0.1% on a monthly basis, compared to a 0.1% gain in June. Year-on-year, PPI is expected to come in at -1.1%, compared to -0.8% a month earlier. If confirmed, this would be the highest deflation since April.
The PPI is an output index – it measures price changes from the makers of a product. Unlike CPI, these price changes are measured from the seller’s perspective. The PPIs are used as an aspect of output for the seller and as a cost factor for the buyer. PPI is considered as a leading indicator of consumer price inflation as inflationary pressures on producers are then passed on to retailers and ultimately – to consumers. The PPI does not only serve as an early indicator of inflationary pressures in the economy before it reaches the consumer, but it can also record the evolution of prices over longer time periods.
United States data
Activity in United States’ manufacturing sector probably continued to expand during August, with the corresponding ISM manufacturing PMI expected to come in at a reading of 56.8, according to expectations, from 57.1 in July. If confirmed, this would be the fifteenth straight month of factory growth.
The Institute of Supply Management releases its Manufacturing Report on Business each month, giving a complete overview of the countrys manufacturing sector. It is based on five main indicators with different weight: New Orders, Production, Employment, Supplier Deliveries and Inventories.
The Institute of Supply Management conducts a survey among the executives of more than 400 industrial companies, which are asked to share their opinion regarding the economic conditions in which they operate. Rising readings, and especially better-than-expected ones, are bullish for the US dollar, and vice versa.
At 13:45, Markit Economics will report separately on US factory growth during August. According to preliminary estimates, the respective Manufacturing PMI is expected to confirm the preliminary reading of 58.0, released on August 21st, marking a considerable acceleration of growth compared to Julys 55.8. If confirmed, this would be the highest pace of expansion since April 2010, rebounding from Julys three-month low.
Technical view
According to Binary Tribune’s daily analysis, the central pivot point for the pair is at 1.3130. In case EUR/USD manages to breach the first resistance level at 1.3143, it will probably continue up to test 1.3158. In case the second key resistance is broken, the pair will probably attempt to advance to 1.3171.
If EUR/USD manages to breach the first key support at 1.3115, it will probably continue to slide and test 1.3102. With this second key support broken, movement to the downside will probably continue to 1.3087.
The mid-Pivot levels for today are as follows: M1 – 1.3095, M2 – 1.3109, M3 – 1.3123, M4 – 1.3137, M5 – 1.3151, M6 – 1.3165.
In weekly terms, the central pivot point is at 1.3161. The three key resistance levels are as follows: R1 – 1.3192, R2 – 1.3251, R3 – 1.3282. The three key support levels are: S1 – 1.3102, S2 – 1.3071, S3 – 1.3012.


