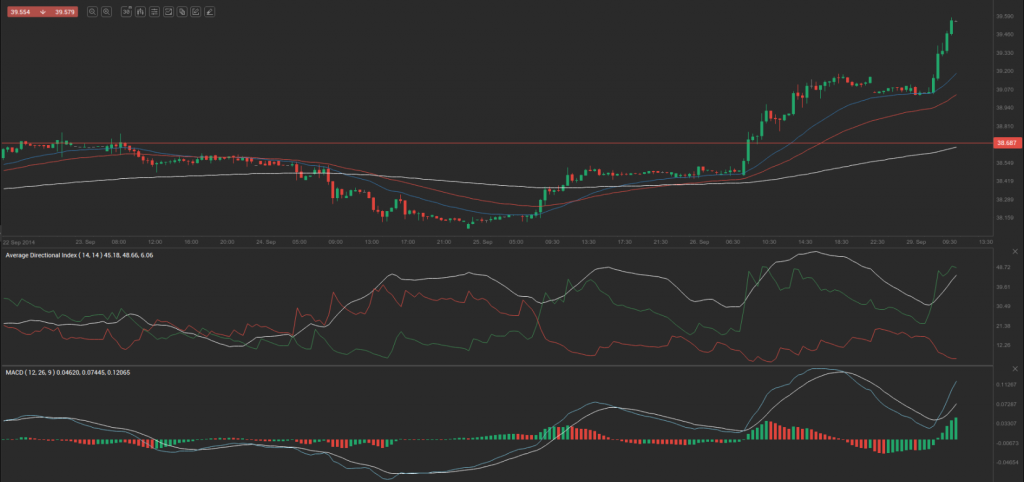
Friday’s trade saw USD/RUB within the range of 38.487-39.197. The pair closed at 39.142, gaining 1.69% on a daily basis.
At 7:54 GMT today USD/RUB was up 1.07% for the day to trade at 39.564. The pair broke the first key daily resistance and the first key weekly resistance levels and touched a fresh record high at 39.589 at 7:56 GMT.
Fundamental view
United States
Personal Spending and Income
Personal spending in the United States probably rose 0.5% in August compared to a month ago, according to market expectations, while personal income was probably up 0.3%. Spending dropped 0.1% in July, which has been the first decline in six months. At the same time, personal income increased 0.2% (or 28.6 billion USD) in July, while disposable personal income (DPI) rose 17.7 billion USD (or 0.1%). Private wages and salaries increased 12.9 billion USD in July, in comparison with an increase of 25.6 billion USD in June. Higher than expected rates of increase imply good employment conditions and, therefore, are dollar positive. The Bureau of Economic Analysis is to publish the official figures at 12:30 GMT.
Pending Home Sales
The index of pending home sales in the United States probably decreased 0.6% during August compared to July, when sales rose 3.3%. In annual terms, pending home sales fell 2.1% in July, or the least since November 2013.
When a sales contract is accepted for a property, it is recorded as a pending home sale. As an indicator the index provides information on the number of future home sales, which are in the pipeline. It gathers data from real estate agents and brokers at the point of a sale of contract and is currently the most accurate indicator regarding US housing sector. It samples over 20% of the market. In addition, over 80% of pending house sales are converted to actual home sales within 2 or 3 months. Therefore, this index has a predictive value about actual home sales.
Although there are some cancellations, there are not enough for the data to be skewed one way or another. The base value of the index is equal to 100, while the base year is 2001, when there has been high activity in the US housing sector.
The National Association of Realtor’s (NAR) will release the official index reading at 14:00 GMT. In case pending home sales dropped more than anticipated, this would have a bearish effect on the greenback.
“The medium-term trend is still higher U.S. yields and a higher U.S. dollar,” said Joseph Capurso, a currency strategist at Commonwealth Bank of Australia, cited by Bloomberg News. “The Fed is going to go well ahead of the Bank of Japan and Europe, and most other central banks in terms of tightening.”
Technical view
According to Binary Tribune’s daily analysis, the central pivot point for the pair is at 38.942. In case USD/RUB manages to breach the first resistance level at 39.397, it will probably continue up to test 39.652. In case the second key resistance is broken, the pair will probably attempt to advance to 40.107.
If USD/RUB manages to breach the first key support at 38.687, it will probably continue to slide and test 38.232. With this second key support broken, the movement to the downside will probably continue to 37.977.
The mid-Pivot levels for today are as follows: M1 – 38.105, M2 – 38.460, M3 – 38.815, M4 – 39.170, M5 – 39.525, M6 – 39.880.
In weekly terms, the central pivot point is at 38.824. The three key resistance levels are as follows: R1 – 39.515, R2 – 39.887, R3 – 40.578. The three key support levels are: S1 – 38.452, S2 – 37.761, S3 – 37.389.
How far up do you think USD/RUB may go over the next few days?
Share your opinion in the comments below.


