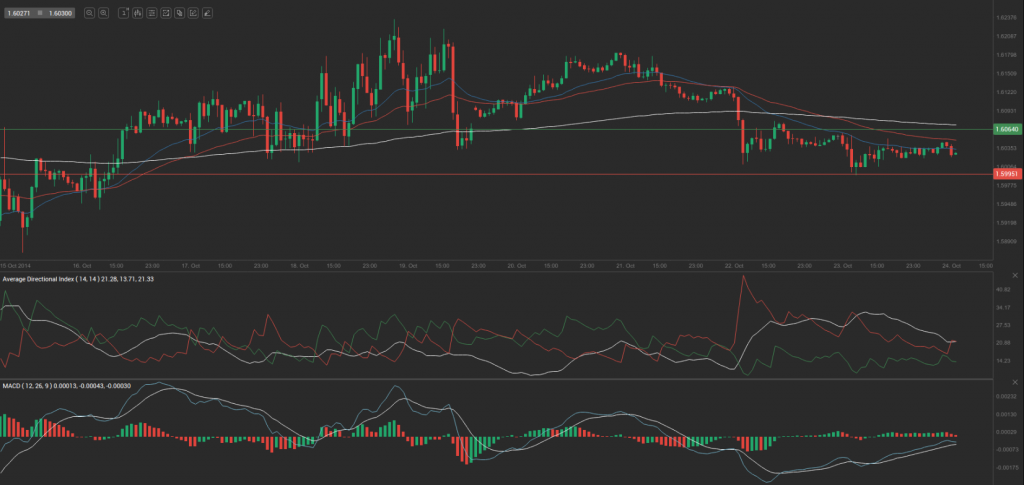
Yesterday’s trade saw GBP/USD within the range of 1.5993-1.6062. The pair closed at 1.6031, losing 0.12% on a daily basis.
At 7:00 GMT today GBP/USD was down 0.03% for the day to trade at 1.6026. The pair touched a daily low at 1.6022 at 6:44 GMT.
Fundamentals
United Kingdom
The preliminary estimate of United Kingdoms GDP probably showed that economy expanded at a rate of 3.0% during the third quarter of the year compared to the same period a year ago. UK economy expanded at an annualized rate of 3.2% in the second quarter of the current year, according to final data, and has also been growing persistently since Q4 2012.
Between Q2 2013 and Q2 2014 production output rose 2.4%, as all production industries contributed positively to this quarter on same quarter a year ago increase, with the exception of electricity, gas, steam and air conditioning, which contracted 6.6%. Household final consumption expenditure increased 2.1%, government expenditure – 1.2% and gross fixed capital formation – 9.1%. The net trade balance has deteriorated slightly in Q2 compared to Q2 2013, according to data by the Office for National Statistics.
On a quarterly basis, the preliminary estimate of UK GDP probably showed a 0.7% growth during Q3, after in Q2 economy expanded at a rate of 0.9%, according to final data, released on September 30th.
The GDP represents the total monetary value of all goods and services produced by one nation over a specific period of time. What is more, it is the widest indicator of economic activity in the country. The report on GDP is of huge importance for traders, operating in the Foreign Exchange Market, because it serves as evidence of growth in a productive economy, or as evidence of contraction in an unproductive one. As a result, currency traders will look for higher rates of growth as a sign that interest rates will follow the same direction. Higher interest rates will usually attract more investors, willing to purchase assets in the UK, while, at the same time, this will increase demand for the pound. Therefore, in case growth rate exceeded market expectations, this would provide support to the local currency. The Office for National Statistics is expected to release the preliminary GDP estimate at 8:30 GMT.
United States
Sales of new single-family homes probably declined 5.8% to the seasonally adjusted annual rate of 470 000 during September compared to a month ago, according to market expectations. The index of new home sales surged 18.0% to the annual rate of 504 000 in August, which has been the highest level since May 2008. The median sales price of new houses sold in August was 275 600 USD, while the average sales price was 347 900 USD. The seasonally adjusted estimate of new houses for sale at the end of August was 203 000, which represents a supply of 4.8 months at the current sales rate, according to the report by the US Census Bureau.
There are several points to watch out for when interpreting the New Home Sales numbers. First of all, the statistics does not record any houses that are not going to be sold immediately. As an example, the case when a house is commissioned to be built on an existing plot of land, that the purchaser owns.
Second, the statistics are taken at the point where a customer has signed a sales contract or has put a deposit down. At this point the house can be at any stage of construction.
Third, the sales figures are not adjusted to take into account the sales contracts, which are eventually canceled by the builder or the customer. However, the same house is not included in any subsequent count when it is eventually sold to another customer.
This report has a significant influence on the Forex market, because increasing new home sales can lead to a rise in consumption, for example. The new home sales index is also an excellent indicator of any economic downturns or upturns due to the sensitivity of consumers income. When, for instance, new home sales drop over several months, this usually is a precursor to an economic depression.
Therefore, in case the index fell more than anticipated, this would usually mount selling pressure on the greenback. The Census Bureau is to report the official figure at 14:00 GMT.
Pivot Points
According to Binary Tribune’s daily analysis, the central pivot point for the pair is at 1.6029. In case GBP/USD manages to breach the first resistance level at 1.6064, it will probably continue up to test 1.6098. In case the second key resistance is broken, the pair will probably attempt to advance to 1.6133.
If GBP/USD manages to breach the first key support at 1.5995, it will probably continue to slide and test 1.5960. With this second key support broken, the movement to the downside will probably continue to 1.5926.
The mid-Pivot levels for today are as follows: M1 – 1.5943, M2 – 1.5978, M3 – 1.6012, M4 – 1.6047, M5 – 1.6081, M6 – 1.6116.
In weekly terms, the central pivot point is at 1.6032. The three key resistance levels are as follows: R1 – 1.6191, R2 – 1.6287, R3 – 1.6446. The three key support levels are: S1 – 1.5936, S2 – 1.5777, S3 – 1.5681.


