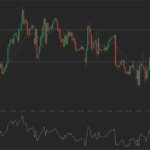
Friday’s trade saw USD/MXN within the range of 13.5120-13.5767. The pair closed at 13.5587, losing 0.03% on a daily basis.
At 9:07 GMT today USD/MXN was up 0.18% for the day to trade at 13.5830. The pair touched a daily high at 13.5834 at 9:01 GMT.
Fundamentals
United States
Services PMI by Markit – preliminary estimate
Activity in the US sector of services probably slowed down in October, with the corresponding preliminary Purchasing Managers’ Index coming in at a reading of 57.0. If so, this would be the lowest index reading since April, when the final value was reported at 55.0. In September the final seasonally adjusted PMI stood at 58.9, up from a preliminary value of 58.5. Values above the key level of 50.0 indicate optimism (expanding activity). Lower than expected PMI readings would mount selling pressure on the US dollar. The preliminary data by Markit Economics is due out at 13:45 GMT.
Pending home sales
The index of pending home sales in the United States probably rose 0.3% during September compared to August, according to expectations. In August compared to July sales dropped 1.0%.
When a sales contract is accepted for a property, it is recorded as a pending home sale. As an indicator, the index provides information on the number of future home sales, which are in the pipeline. It gathers data from real estate agents and brokers at the point of a sale of contract and is currently the most accurate indicator regarding US housing sector. It samples over 20% of the market. In addition, over 80% of pending house sales are converted to actual home sales within 2 or 3 months. Therefore, this index has a predictive value about actual home sales.
Although there are some cancellations, there are not enough for the data to be skewed one way or another. The base value of the index is equal to 100, while the base year is 2001, when there has been a high level of home sales.
The National Association of Realtor’s (NAR) will release the official sales data at 14:00 GMT on Monday. In case pending home sales increased more than anticipated, this would have a bullish effect on the greenback.
Mexico
At 13:00 GMT Mexicos Insituto Nacional de Estadistica Y Geografia is expected to report on nation’s trade balance during September. In August the country had a deficit at the amount of USD 1.12 billion, or the second consecutive monthly shortfall and also the largest deficit figure since January. Total exports expanded at an annualized rate of 2.1% to reach USD 33.36 billion in August. Oil sales decreased 10.6%, while non-oil shipments were 4% higher compared to a year earlier. Total imports advanced at an annual pace of 4.8% to USD 34.48 billion in August. Imports of intermediate goods rose the most on the year, by 6.3%, followed by imports of consumption goods – 0.6%.
The trade balance reflects the difference in value between exported and imported goods during the respective period. A positive figure indicates that more goods and services have been exported than imported. Export demand has a direct link to demand for the national currency and also causes an impact on levels of production. In case the deficit on Mexico’s trade balance continued to widen, this would have a bearish effect on the peso.
Pivot Points
According to Binary Tribune’s daily analysis, the central pivot point for the pair is at 13.5491. In case USD/MXN manages to breach the first resistance level at 13.5863, it will probably continue up to test 13.6138. In case the second key resistance is broken, the pair will probably attempt to advance to 13.6510.
If USD/MXN manages to breach the first key support at 13.5216, it will probably continue to slide and test 13.4844. With this second key support broken, the movement to the downside will probably continue to 13.4569.
The mid-Pivot levels for today are as follows: M1 – 13.4707, M2 – 13.5030, M3 – 13.5354, M4 – 13.5677, M5 – 13.6001, M6 – 13.6324.
In weekly terms, the central pivot point is at 13.5358. The three key resistance levels are as follows: R1 – 13.5996, R2 – 13.6405, R3 – 13.7043. The three key support levels are: S1 – 13.4949, S2 – 13.4311, S3 – 13.3902.


