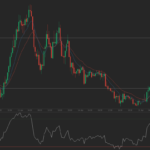
Yesterday’s trade saw GBP/USD within the range of 1.5554 – 1.5717, the highest in five months. The pair closed at 1.5671, surging 0.54% for the day following a 0.97% gain on Monday.
At 07:03 GMT today GBP/USD was down 0.03% for the day to trade at 1.5665. The cross held in a daily range between 1.5660 and 1.5689.
Fundamentals
United Kingdom
The Claimant Count Change, which represents the change in the number of unemployed people in the UK during the respective month, probably registered a drop of 20 000 in April, following a 20 700 decline in March. A revised 29 100 decrease was registered in February. The Office for National Statistics will release the report at 08:30 GMT.
Meanwhile, the unemployment rate in the UK probably slid to 5.5% in the three months March, the ONS is also expected to report. The metric gauges the number of unemployed people actively seeking employment as a percentage of the labor force.
The jobless rate fell to 5.6% in the three months through February, the lowest since mid-2008, from 5.7% during the previous period. There were 1.84 million people unemployed, 76 000 less than September-November 2014 and 416 000 compared to a year earlier.
Employment accelerated at its fastest pace in nearly a year while pay growth rose well above inflation. The employment rate was 73.4%, the highest since records began in 1971.
The ONS is also expected to report that wage growth saw a continued growth, with the Average Earnings Index including Bonus projected to have risen by an annualized 1.7% in the three months through March, following another 1.7% jump in February. If confirmed, this would be the ninth straight month of pay growth. Average Earnings excluding Bonus likely rose by 2.1%, according to analysts estimates.
United States
Retail sales in the United States probably jumped 0.2% in April on a monthly basis, according to the median forecast by experts. In March, the metric recorded a 0.9% gain which followed a 0.5% decline in February and another 0.8% decrease a month earlier.
The report on retail sales reflects the dollar value of merchandise sold within the retail trade by taking a sampling of companies operating in the sector of selling physical end products to consumers. The retail sales report encompasses both fixed point-of-sale businesses and non-store retailers, such as mail catalogs and vending machines. The Census Bureau, which is a part of the Department of Commerce, surveys about 5 000 companies of all sizes, from huge retailers such as Wal-Mart to independent small family firms.
US core retail sales, or retail sales ex autos, probably went up 0.5% last month, following a 0.4% increase in March. This indicator removes large ticket prices and historical seasonality of automobile sales.
The retail sales index is considered as a coincident indicator, thus, it reflects the current state of the economy. It is also deemed a pre-inflationary indicator, which investors can use in order to reassess the probability of an interest rate hike or cut by the Federal Reserve Bank. In addition, this indicator provides key information regarding consumer spending trends. Consumer expenditures, on the other hand, account for almost two-thirds of the US Gross Domestic Product. Therefore, a larger-than-expected rate of increase in sales would certainly boost the US dollar. The official report is due out at 12:30 GMT.
Import and export prices
A separate report by the Labor Department is expected to show that export prices in the US rose 0.1% on a monthly basis in April, following another 0.1% gain in March which ended seven straight monthly contractions. This index measures the changes in prices of of goods and services sold by US residents to foreign buyers. It is used to determine whether an increase in the headline Exports figure, part of the trade balance, is based on a change in trade volume or a change in prices. Export prices are heavily impacted by exchange rates. A higher-than-expected reading should be considered bullish for the US dollar.
Meanwhile, import prices likely rose as well in April, with the corresponding US Import Price Index projected to come in at 0.3%, offsetting a 0.3% contraction the previous month. Opposite to the export price index, this gauge measures the change in prices of goods and services purchased by US residents from, and supplied by, foreign sellers. It, also, is used to determine whether an increase in the headline Imports figure is based on a change in trade volume or a change in prices, with currency movements heavily affecting the figure. The official data is due out at 12:30 GMT.
Pivot points
According to Binary Tribune’s daily analysis, the pair’s central pivot point stands at 1.5647. In case it penetrates the first resistance level at 1.5741, it will encounter next resistance at 1.5810. If breached, upside movement may attempt to advance to 1.5904.
If the cross drops below its S1 level at 1.5578, it will next see support at 1.5484. If the second key support zone is breached, downward movement may extend to 1.5415.
In weekly terms, the central pivot point is at 1.5356. The three key resistance levels are as follows: R1 – 1.5625, R2 – 1.5794, R3 – 1.6063. The three key support levels are: S1 – 1.5187, S2 – 1.4918, S3 – 1.4749.


