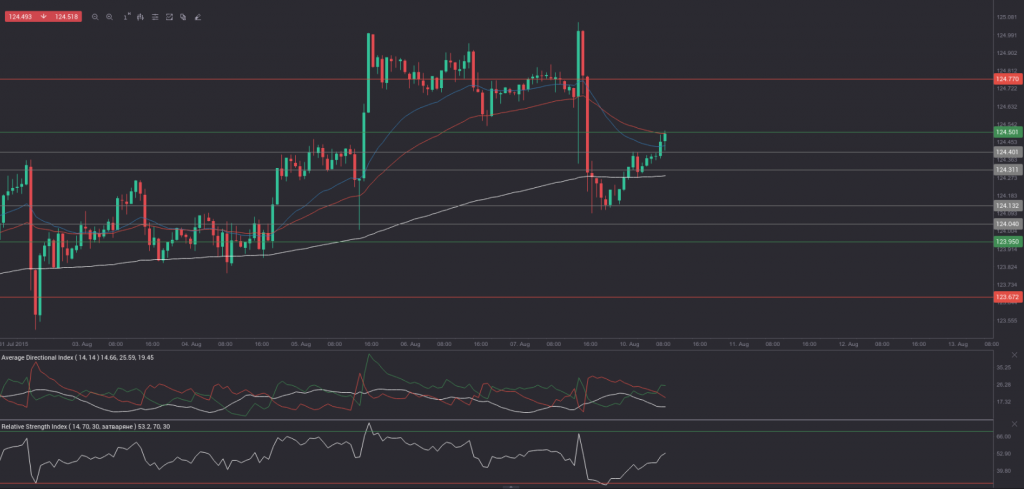
Friday’s trade saw USD/JPY within the range of 124.08-125.08. The pair closed at 124.22, down 0.42% on a daily basis, or the most considerable daily loss since July 27th, when it depreciated 0.42%. The daily high has also been the highest level since June 8th, when the cross registered a high of 125.69.
At 8:51 GMT today USD/JPY was up 0.31% for the day to trade at 124.67. The pair is set to test the range breakout level (R4), as it touched a daily high at 124.71 at 8:24 GMT.
No relevant macroeconomic reports are to be released from both the United States and Japan today.
Correlation with other Majors
Taking into account the week ended on August 9th and the daily closing levels of the major currency pairs, we come to the following conclusions in regard to the strength of relationship:
USD/JPY to USD/CHF (0.4589, or moderate)
USD/JPY to AUD/USD (0.1459, or weak)
USD/JPY to GBP/USD (0.1193, or weak)
USD/JPY to USD/CAD (0.0492, or very weak)
USD/JPY to EUR/USD (-0.5351, or strong)
USD/JPY to NZD/USD (-0.6391, or strong)
1. During the examined period USD/JPY moved to a moderate extent in one and the same direction with USD/CHF.
2. USD/JPY moved strongly in the opposite direction compared to EUR/USD and NZD/USD during the past week.
3. The correlation between USD/JPY and AUD/USD and between USD/JPY and GBP/USD was insignificant during the examined period.
4. USD/JPY moved almost independently compared to USD/CAD during the past week.
Bond Yield Spread
The yield on Japanese 2-year government bonds went as high as 0.011% on August 7th, after which it slid to 0.010% at the close to lose 0.001 percentage point on a daily basis, while marking a second consecutive day of decline.
The yield on US 2-year government bonds climbed as high as 0.749% on August 7th, or the highest level since August 5th (0.760%), after which it fell to 0.721% at the close to gain 1.2 basis points (0.012 percentage point) for the day. It has been the first gain in the past three trading days.
The spread between 2-year US and 2-year Japanese bond yields, which reflects the flow of funds in a short term, widened to 0.711% on August 7th from 0.698% during the prior day. The August 7th yield spread has been the most notable one since August 5th, when the difference was 0.720%.
Meanwhile, the yield on Japans 10-year government bonds soared as high as 0.430% on August 7th, or the highest level since July 22nd (0.435%), after which it slid to 0.421% at the close to lose 0.003 percentage point compared to August 6th. It has been the first drop in the past three trading days.
The yield on US 10-year government bonds climbed as high as 2.254% on August 7th, after which it slipped to 2.166% at the close to lose 6.1 basis points (0.061 percentage point) on a daily basis, while marking a second consecutive day of decline.
The spread between 10-year US and 10-year Japanese bond yields narrowed to 1.745% on August 7th from 1.803% during the prior day. The August 7th yield difference has been the lowest one since August 3rd, when the spread was 1.734%.
Daily and Weekly Pivot Levels
By employing the Camarilla calculation method, the daily pivot levels for USD/JPY are presented as follows:
R1 – 124.31
R2 – 124.40
R3 (range resistance – green on the 1-hour chart) – 124.50
R4 (range breakout – red on the 1-hour chart) – 124.77
S1 – 124.13
S2 – 124.04
S3 (range support – green on the 1-hour chart) – 123.95
S4 (range breakout – red on the 1-hour chart) – 123.67
By using the traditional method of calculation, the weekly pivot levels for USD/JPY are presented as follows:
Central Pivot Point – 124.36
R1 – 124.94
R2 – 125.67
R3 – 126.25
S1 – 123.63
S2 – 123.05
S3 – 122.32


