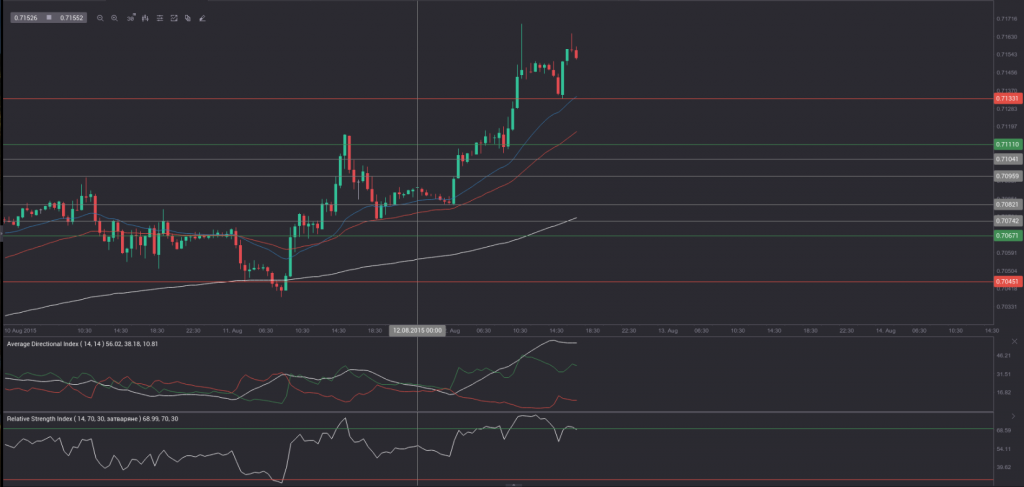
Yesterday’s trade saw EUR/GBP within the range of 0.7037-0.7117. The pair closed at 0.7089, soaring 0.31% on a daily basis. The daily high has also been the highest level since July 28th, when the cross registered a high of 0.7133.
At 14:26 GMT today EUR/GBP was up 0.93% for the day to trade at 0.7159. The pair overcame the upper range breakout level (R4), as it touched a daily high at 0.7170 at 8:30 GMT. It has been the highest level since July 13th, when the cross reached a daily high of 0.7203.
EUR/GBP still has room to run until it reaches the weekly R2 level. In case of a successful breach of that point, the cross may next find resistance at July 13th high.
Correlation with Major Pairs
Taking into account the week ended on August 9th and the daily closing levels of the currency pairs involved, we come to the following conclusions in regard to the strength of relationship:
EUR/GBP to NZD/USD (0.9233, or very strong)
EUR/GBP to EUR/USD (0.8654, or very strong)
EUR/GBP to USD/CHF (0.3694, or moderate)
EUR/GBP to AUD/USD (0.3259, or moderate)
EUR/GBP to USD/JPY (-0.3984, or moderate)
EUR/GBP to USD/CAD (-0.8375, or very strong)
EUR/GBP to GBP/USD (-0.8400, or very strong)
1. During the examined period EUR/GBP moved almost equally in one and the same direction with NZD/USD and EUR/USD, while moving almost equally in the opposite direction compared to USD/CAD and GBP/USD.
2. EUR/GBP moved to a moderate extent in the opposite direction compared to USD/JPY during the past week.
3. EUR/GBP moved to a moderate extent in one and the same direction with USD/CHF and AUD/USD during the period in question.
Bond Yield Spread
The yield on German 2-year government bonds went as high as -0.265% on August 11th, after which it slid to -0.278% at the close to lose 0.009 percentage point on a daily basis, while marking a fourth consecutive trading day of decline.
The yield on UK 2-year government bonds climbed as high as 0.620% on August 11th, after which it fell to 0.581% at the close to lose 4.7 basis points (0.047 percentage point) for the day.
The spread between 2-year UK and 2-year German bond yields, which reflects the flow of funds in a short term, shrank to 0.859% on August 11th from 0.897% during the prior day. The August 11th yield spread has been the lowest one since August 7th, when the difference was 0.848%.
Meanwhile, the yield on German 10-year government bonds soared as high as 0.705% on August 11th, after which it slid to 0.634% at the close to lose 6.4 basis points (0.064 percentage point) compared to August 10th.
The yield on UK 10-year government bonds climbed as high as 1.932% on August 11th, after which it slipped to 1.828% at the close to lose 9.4 basis points (0.094 percentage point) on a daily basis.
The spread between 10-year UK and 10-year German bond yields narrowed to 1.194% on August 11th from 1.224% during the prior day. The August 11th yield difference has been the lowest one since August 7th, when the spread was 1.190%.
Taking into account the period January-July 2015 and basing our calculations on weekly closing prices, we came to the conclusion that EUR/GBP performance and the development of the yield spread between 10-year bonds in the United Kingdom and Germany showed a correlation of -0.3525, or the pair and the spread moved to a moderate extent in opposite directions. As the yield spread grew in favor of the 10-year UK bonds, the UK pound gained ground against the euro. During the period January-July, EUR/GBP has depreciated 9.96%, while the spread between 10-year bond yields in both countries has widened 11.57% to reach approximately 1.23% in late July from approximately 1.11% in early January.
Daily and Weekly Pivot Levels
By employing the Camarilla calculation method, the daily pivot levels for EUR/GBP are presented as follows:
R1 – 0.7096
R2 – 0.7104
R3 (range resistance – green on the 30-minute chart) – 0.7111
R4 (range breakout – red on the 30-minute chart) – 0.7133
S1 – 0.7082
S2 – 0.7074
S3 (range support – green on the 30-minute chart) – 0.7067
S4 (range breakout – red on the 30-minute chart) – 0.7045
By using the traditional method of calculation, the weekly pivot levels for EUR/GBP are presented as follows:
Central Pivot Point – 0.7041
R1 – 0.7134
R2 – 0.7190
R3 – 0.7283
S1 – 0.6985
S2 – 0.6892
S3 – 0.6836


