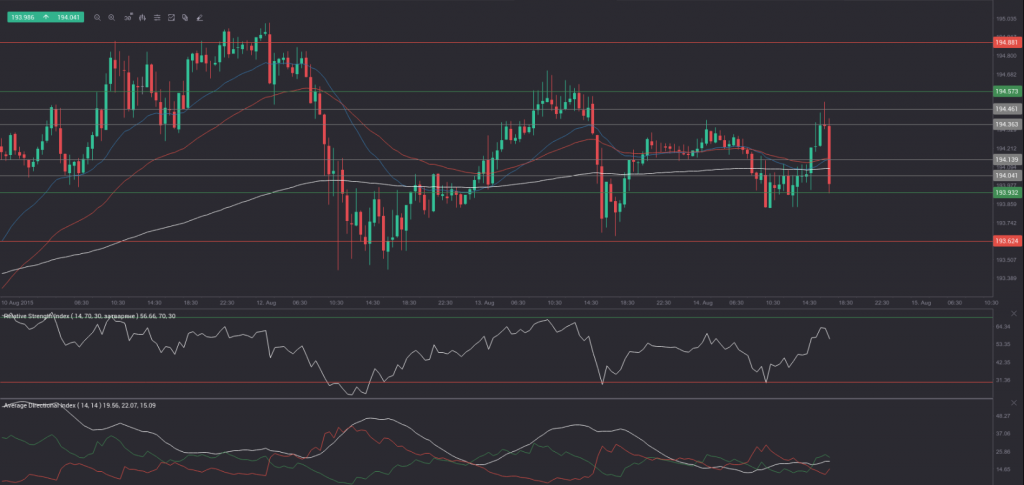
Yesterday’s trade saw GBP/JPY within the range of 193.63-194.78. The pair closed at 194.25, surging 0.16% on a daily basis, or the smallest daily gain since August 4th, when it added 0.13%. On August 12th the cross went up as high as 195.06, or the highest level since August 6th, when a daily high of 195.28 was recorded.
At 14:44 GMT today GBP/JPY was up 0.07% for the day to trade at 194.40. The pair touched a daily high at 194.54 at 14:20 GMT.
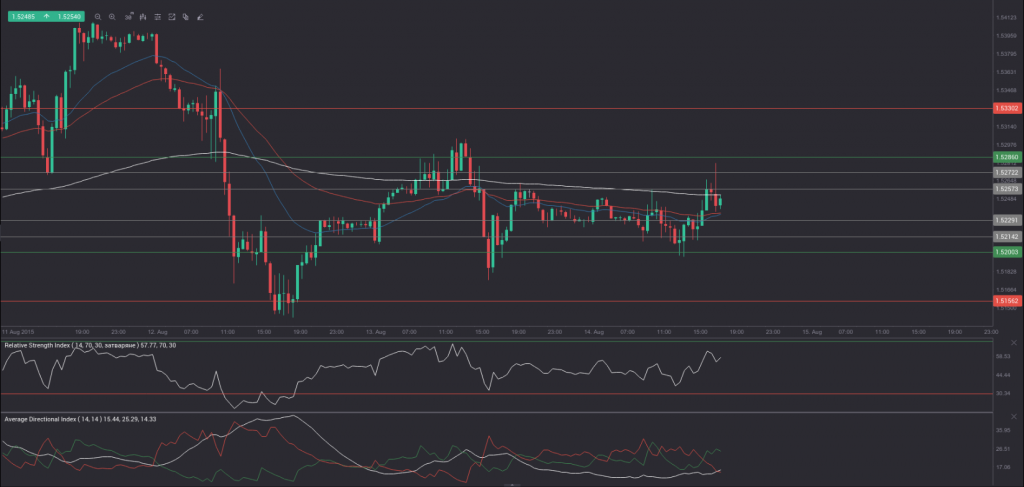
On Thursday GBP/CHF traded within the range of 1.5165-1.5323. The pair closed at 1.5243, ticking up 0.07% on a daily basis, or the lowest daily gain rate since July 10th, when it added a mere 0.01%. On August 12th GBP/CHF went up as high as 1.5422, or a level unseen since January 15th, when a daily high of 1.5551 was reached.
At 14:44 GMT today GBP/CHF was up 0.22% for the day to trade at 1.5272. The pair is set to test the range resistance level (R3), as it touched a daily high at 1.5274 at 14:43 GMT.
Daily and Weekly Pivot Levels
GBP/JPY
By employing the Camarilla calculation method, the daily pivot levels for GBP/JPY are presented as follows:
R1 – 194.36
R2 – 194.46
R3 (range resistance – green on the 30-minute chart) – 194.57
R4 (range breakout – red on the 30-minute chart) – 194.88
S1 – 194.14
S2 – 194.04
S3 (range support – green on the 30-minute chart) – 193.93
S4 (range breakout – red on the 30-minute chart) – 193.62
By using the traditional method of calculation, the weekly pivot levels for GBP/JPY are presented as follows:
Central Pivot Point – 193.23
R1 – 194.55
R2 – 196.60
R3 – 197.92
S1 – 191.18
S2 – 189.86
S3 – 187.81
GBP/CHF
By employing the Camarilla calculation method, the daily pivot levels for GBP/CHF are presented as follows:
R1 – 1.5257
R2 – 1.5272
R3 (range resistance – green on the 30-minute chart) – 1.5286
R4 (range breakout – red on the 30-minute chart) – 1.5330
S1 – 1.5229
S2 – 1.5214
S3 (range support – green on the 30-minute chart) – 1.5200
S4 (range breakout – red on the 30-minute chart) – 1.5156
By using the traditional method of calculation, the weekly pivot levels for GBP/CHF are presented as follows:
Central Pivot Point – 1.5224
R1 – 1.5403
R2 – 1.5559
R3 – 1.5738
S1 – 1.5068
S2 – 1.4889
S3 – 1.4733


