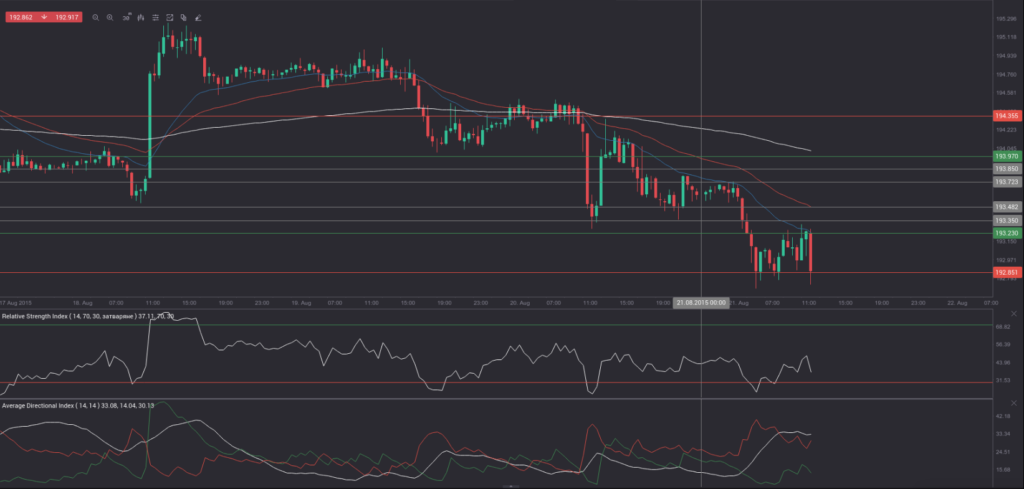
Yesterday’s trade saw GBP/JPY within the range of 193.22-194.58. The pair closed at 193.60, down 0.27% on a daily basis and extending losses from Wednesday. The daily low has also been the lowest level since August 10th, when the cross registered a low of 192.22.
At 9:05 GMT today GBP/JPY was down 0.19% for the day to trade at 193.25. The pair overshot the lower range breakout level (S4), as it touched a daily low at 192.72 at 3:05 GMT. It is now the new lowest level since August 10th.
No relevant macroeconomic reports and/or events are scheduled in both the UK and Japan for today.
Bond Yield Spread
The yield on Japanese 2-year government bonds went as high as 0.008% on August 20th, or matching the high levels registered during the prior two trading days, after which it slid to 0.006% at the close to gain 0.001 percentage point on a daily basis.
The yield on UK 2-year government bonds climbed as high as 0.572% on August 20th, after which it fell to 0.550% at the close to lose 1.1 basis points (0.011 percentage point) for the day, while marking a second consecutive day of decline.
The spread between 2-year UK and 2-year Japanese bond yields, which reflects the flow of funds in a short term, narrowed to 0.544% on August 20th from 0.554% during the prior day. The August 20th difference has been the lowest one since July 9th, when the yield spread was 0.534%.
Meanwhile, the yield on Japan’s 10-year government bonds soared as high as 0.378% on August 20th, after which it slid to 0.375% at the close to lose 0.002 percentage point compared to August 19th.
The yield on UK 10-year government bonds climbed as high as 1.805% on August 20th, after which it slipped to 1.750% at the close to lose 9.4 basis points (0.094 percentage point) on a daily basis, while marking a second consecutive day of decrease.
The spread between 10-year UK and 10-year Japanese bond yields shrank to 1.375% on August 20th from 1.467% during the prior day. The August 20th yield difference has been the lowest one in more than three months.
Daily and Weekly Pivot Levels
By employing the Camarilla calculation method, the daily pivot levels for GBP/JPY are presented as follows:
R1 – 193.72
R2 – 193.85
R3 (range resistance – green on the 30-minute chart) – 193.97
R4 (range breakout – red on the 30-minute chart) – 194.35
S1 – 193.48
S2 – 193.35
S3 (range support – green on the 30-minute chart) – 193.23
S4 (range breakout – red on the 30-minute chart) – 192.85
By using the traditional method of calculation, the weekly pivot levels for GBP/JPY are presented as follows:
Central Pivot Point – 193.91
R1 – 195.61
R2 – 196.75
R3 – 198.45
S1 – 192.77
S2 – 191.07
S3 – 189.93


