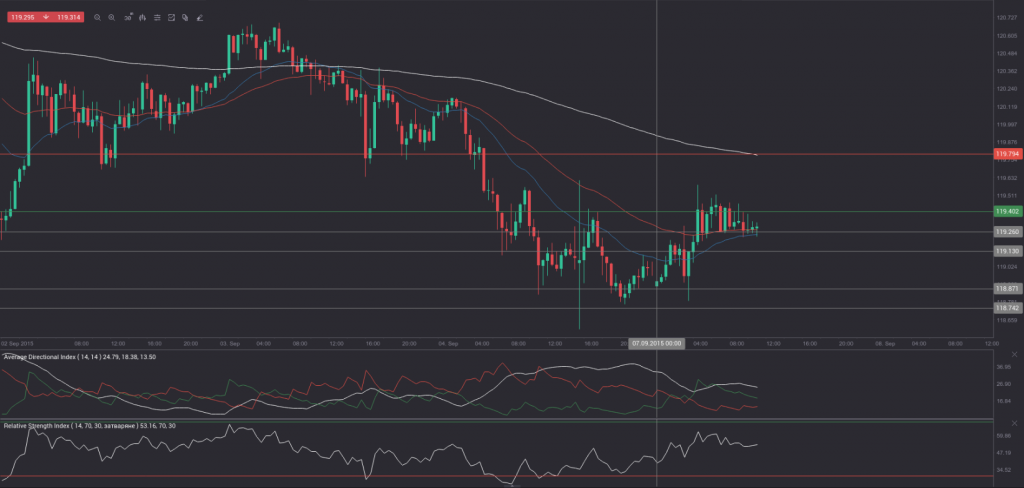
Friday’s trade saw USD/JPY within the range of 118.75-120.19. The pair closed at 119.00, plummeting 0.90% on a daily basis and extending losses from Thursday. It has been the most considerable daily rate of decline since September 1st, when the cross depreciated 1.52%. The daily low has also been the lowest level since August 26th, when the cross registered a low of 118.43.
At 7:55 GMT today USD/JPY was up 0.23% for the day to trade at 119.28. The pair overcame the range resistance level (R3), as it touched a daily high at 119.59 during the Asian session.
Today the cross may be influenced by a number of macroeconomic reports as listed below.
Fundamentals
United States
Labor Day
The first Monday of September is the Labor Day National Holiday in the United States. Many people tend to mark this day as the summers end and usually organize a number of outdoor activities. Government offices, schools and organizations and a number of businesses are to remain closed. US markets will be closed as well.
Japan
Gross Domestic Product – final estimate
Japans final annualized GDP estimate probably showed a 1.8% contraction during the second quarter of the year, according to the median forecast by experts. The preliminary GDP estimate, which was reported on August 16th, pointed to a 1.6% slump. If so, this would be the first GDP drop since Q2 2014, when economy shrank at an annualized rate of 7.3%. In Q1 the Japanese GDP grew at a final 3.9% compared to the same period a year earlier.
On a quarterly basis, the final GDP probably pointed to a 0.4% contraction in Q2, according to expectations, which would match the preliminary estimate. If so, this would be the first quarterly drop since Q3 2014, when Japans economy shrank at a final 0.6%.
According to the preliminary report, private demand in the country was 0.4% lower in Q2, subtracting 0.3 percentage point from overall growth. Private consumption, which accounts for almost 60% of the GDP, dropped 0.8%, subtracting 0.4 percentage point from growth. At the same time, private non-residential investment shrank 0.1% in Q2. On the other hand, private residential investment expanded 1.9%, adding 0.1% to overall growth. Japanese exports decreased 4.4%, subtracting 0.8% from growth, while imports fell 2.6%, providing a 0.5% contribution, according to data by Japans Cabinet Office. In Q1 the nations GDP rose 1.0% compared to the preceding quarter.
In case Japans GDP growth rate met expectations or even went deeper into negative territory in Q2, this would have a strong bearish effect on the yen. The final GDP data is due out at 23:50 GMT.
Correlation with other Majors
Taking into account the week ended on September 6th and the daily closing levels of the major currency pairs, we come to the following conclusions in regard to the strength of relationship:
USD/JPY to AUD/USD (0.9141, or very strong)
USD/JPY to GBP/USD (0.7791, or strong)
USD/JPY to NZD/USD (0.4766, or moderate)
USD/JPY to USD/CHF (0.0746, or very weak)
USD/JPY to EUR/USD (-0.0005, or very weak)
USD/JPY to USD/CAD (-0.8029, or very strong)
1. During the examined period USD/JPY moved almost equally in one and the same direction with AUD/USD, while moving almost equally in the opposite direction compared to USD/CAD.
2. USD/JPY moved strongly in one and the same direction with GBP/USD during the past week.
3. USD/JPY moved almost independently compared to USD/CHF and EUR/USD.
Bond Yield Spread
The yield on Japanese 2-year government bonds went as high as 0.017% on September 4th, after which it slid to 0.015% at the close to lose 0.003 percentage point on a daily basis. It has been the first drop in the past three trading days.
The yield on US 2-year government bonds climbed as high as 0.733% on September 4th, or the highest level since September 1st (0.735%), after which it fell to 0.709% at the close to add 1.3 basis points (0.013 percentage point) for the day. It has been the first gain in the past four trading days.
The spread between 2-year US and 2-year Japanese bond yields, which reflects the flow of funds in a short term, expanded to 0.694% on September 4th from 0.678% during the prior day. The September 4th yield spread has been the most notable one since September 2nd, when the difference was 0.697%.
Meanwhile, the yield on Japans 10-year government bonds soared as high as 0.396% on September 4th, after which it slid to 0.374% at the close to lose 2.9 basis points (0.029 percentage point) compared to September 3rd. It has been the first drop in the past three trading days.
The yield on US 10-year government bonds climbed as high as 2.169% on September 4th, after which it slipped to 2.131% at the close to lose 3.2 basis points (0.032 percentage point) on a daily basis, while marking a second consecutive trading day of decrease.
The spread between 10-year US and 10-year Japanese bond yields narrowed to 1.757% on September 4th from 1.760% during the prior day. The September 4th yield difference has been the lowest one since August 25th, when the spread was 1.704%.
Daily and Weekly Pivot Levels
By employing the Camarilla calculation method, the daily pivot levels for USD/JPY are presented as follows:
R1 – 119.13
R2 – 119.26
R3 (range resistance – green on the 30-minute chart) – 119.40
R4 (range breakout – red on the 30-minute chart) – 119.79
S1 – 118.87
S2 – 118.74
S3 (range support – green on the 30-minute chart) – 118.60
S4 (range breakout – red on the 30-minute chart) – 118.21
By using the traditional method of calculation, the weekly pivot levels for USD/JPY are presented as follows:
Central Pivot Point – 119.83
R1 – 120.92
R2 – 122.83
R3 – 123.92
S1 – 117.92
S2 – 116.83
S3 – 114.92


