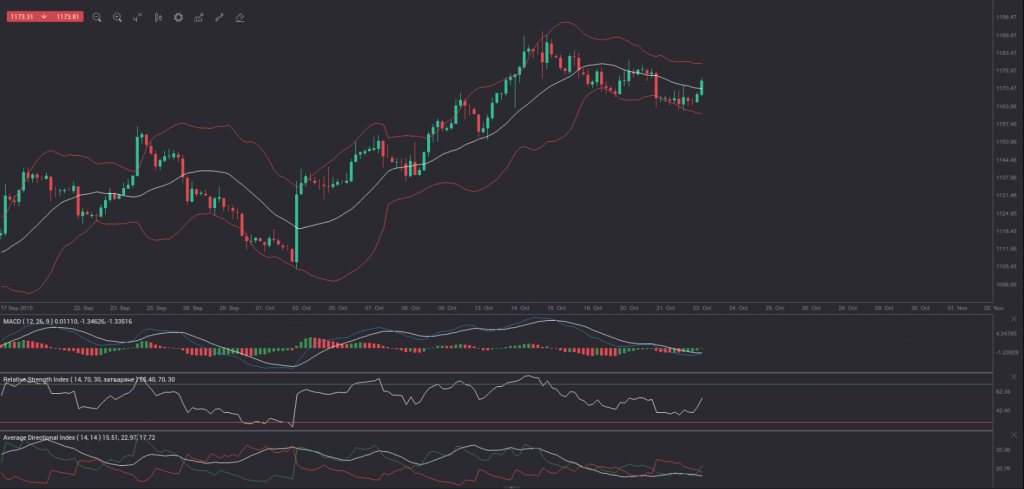
On Thursday gold for delivery in December traded within the range of $1,163.50-$1,168.60. Futures closed at $1,166.60, slipping 0.09% on a daily basis, while extending the loss from Wednesday. The daily low has been the lowest price level since October 13th, when gold went down as low as $1,154.90.
On the Comex division of the New York Mercantile Exchange, gold futures for delivery in December were gaining 0.57% for the day to trade at $1,172.80 per troy ounce. The yellow metal overcame the upper range breakout level (R4), as it went up as high as $1,174.10 earlier today.
The 4-hour chart for gold below reveals that the commodity may be poised to advance further. In case the metal continues to close above the middle Bollinger line, we could expect a test of the upper band around October 20th high of $1,179.10. In addition, the MACD main line (blue) is set to cross the signal line (white) in a bottom up manner, while the Relative Strength Index has just climbed above its 50.00 level. The +DI (green) has just crossed the -DI (red) and the distance between the two is set to expand, also suggesting a bullish move ahead.
Daily and Weekly Pivot Levels
By employing the Camarilla calculation method, the daily pivot levels for gold are presented as follows:
R1 – $1,167.07
R2 – $1,167.54
R3 (range resistance) – $1,168.00
R4 (range breakout) – $1,169.41
S1 – $1,166.13
S2 – $1,165.67
S3 (range support) – $1,165.20
S4 (range breakout) – $1,163.80
By using the traditional method of calculation, the weekly pivot levels for gold are presented as follows:
Central Pivot Point – $1,175.83
R1 – $1,196.77
R2 – $1,209.93
R3 – $1,230.87
S1 – $1,162.67
S2 – $1,141.73
S3 – $1,128.57


