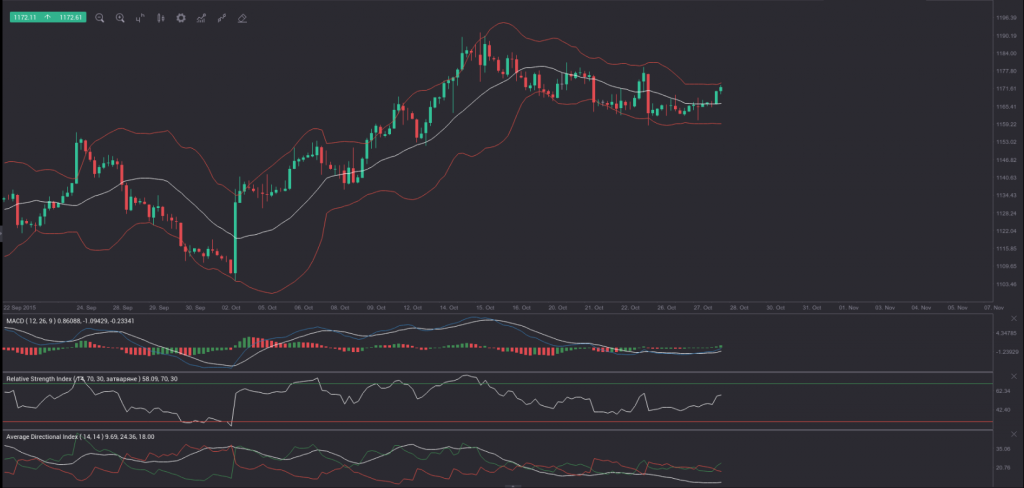
On Tuesday gold for delivery in December traded within the range of $1,162.00-$1,166.10. Futures closed at $1,166.80, ticking down 0.02% on a daily basis, while marking their sixth drop in the past twelve trading days. The daily low has been the lowest level since October 13th, when a low of $1,154.90 was registered.
On the Comex division of the New York Mercantile Exchange, gold futures for delivery in December were gaining 0.60% for the day to trade at $1,172.80 per troy ounce. The yellow metal overcame the upper range breakout level (R4), as it went as high as $1,173.00 earlier today. It has been the highest level since October 23rd, when a daily high of $1,178.70 was reached.
Yesterday gold futures lost ground sharply on the back of upbeat US durable goods, as the latter were reported to have slumped at a lesser pace than anticipated in September, by 1.2% instead of 3.0%. The indicators August performance has been revised down to a 2.3% drop from a 2.0% decrease previously. Orders without taking into account the sector of transportation also fell less than projected in September, by 0.4% instead of 0.9%.
Later in the day gold managed to erase losses, as the Conference Board research group reported that its gauge of consumer confidence for the United States came well below market expectations in October. The index slipped to a reading of 97.6 this month from a revised down 102.6 in September (103.0 previously). It has been the lowest index value since July 2015, when a level of 90.9 was reported.
Todays focus is on the outcome from the Federal Open Market Committees two-day policy meeting. The Committee will probably keep its target for the federal funds rate unchanged within the range 0%-0.25% for a 54th consecutive meeting, according to the median forecast by experts.
In September the Committee left borrowing costs intact, as macroeconomic conditions, which would warrant a hike, had not yet been met, but were approaching. In addition, the Minutes from the Federal Reserve’s most recent policy meeting revealed officials expressed concerns recent global and financial market developments might pose constraints to US economic activity.
In the light of global macroeconomic slowdown led by China and the possible influence on its trading partners, the majority of experts tend to expect that the Fed will probably delay the first hike in almost a decade until the policy meeting in March next year. However, there are also opinions that such a move may be introduced in December. Therefore, the FOMC Statement on policy today will be closely examined by market participants for hints pointing to a hike at the Banks last meeting for the year.
Maintaining borrowing costs at record low levels tends to boost the appeal of gold, because of the muted appetite for risk.
Technically, gold is poised to see further upside. The commodity has pierced the middle Bollinger band and a test of the upper band may be at hand. In addition, bullish momentum has begun to build up, as pointed by the MACD, while the RSI has moved above its 50.00 level and remains at a comfortable distance from the overbought area. The +DI (green on the 4-hour chart) has crossed the -DI (red) in a bottom up manner and the distance between them is set to expand, also suggesting a bullish move.
Daily and Weekly Pivot Levels
By employing the Camarilla calculation method, the daily pivot levels for gold are presented as follows:
R1 – $1,167.18
R2 – $1,167.55
R3 (range resistance) – $1,167.93
R4 (range breakout) – $1,169.06
S1 – $1,166.42
S2 – $1,166.05
S3 (range support) – $1,165.67
S4 (range breakout) – $1,164.55
By using the traditional method of calculation, the weekly pivot levels for gold are presented as follows:
Central Pivot Point – $1,168.57
R1 – $1,173.83
R2 – $1,184.37
R3 – $1,189.63
S1 – $1,158.03
S2 – $1,152.77
S3 – $1,142.23


