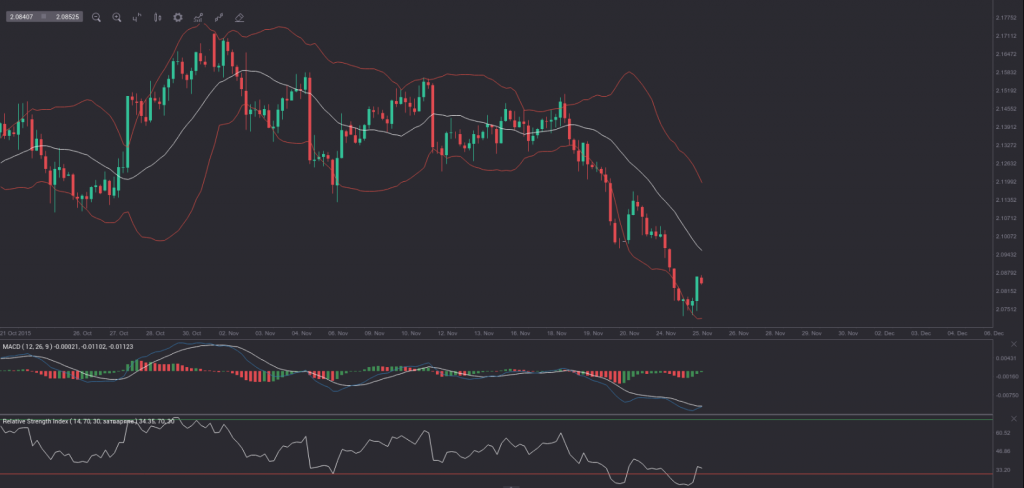
Yesterday’s trade saw GBP/AUD within the range of 2.0735-2.1062. The pair closed at 2.0789, plummeting 1.11% on a daily basis, while marking its sixth drop in the past twelve trading days. The daily low has been the lowest level since July 10th, when a low of 2.0528 was registered. In weekly terms, GBP/AUD went down 1.78% last week, marking its sharpest weekly decline since the week ended on October 11th, when it plunged 3.14%.
At 14:58 GMT today GBP/AUD was gaining 0.29% for the day to trade at 2.0844. The pair touched a daily high at 2.0877 at 14:35 GMT, undershooting the range resistance level (R3).
Technical Outlook
GBP/AUD has been deeply oversold recently, as indicated by the 14-period RSI and the 20-period Bollinger. As the RSI crossed the oversold level (30.00) in a bottom-up manner, the pair has moved a certain distance away from the four-and-a-half-month lows, while bearish momentum has begun to fade. In case, however, GBP/AUD continues to hold strongly below the middle Bollinger band, it may be forming a steep bear channel, aiming to test the low from July 10th (2.0528) and after that the low from July 3rd (2.0408). On the other hand, resistance may be encountered at the high from November 24th (2.1062).
Daily and Weekly Pivot Levels
By employing the Camarilla calculation method, the daily pivot levels for GBP/AUD are presented as follows:
R1 – 2.0819
R2 – 2.0850
R3 (range resistance) – 2.0879
R4 (range breakout) – 2.0969
S1 – 2.0759
S2 – 2.0728
S3 (range support) – 2.0698
S4 (range breakout) – 2.0609
By using the traditional method of calculation, the weekly pivot levels for GBP/AUD are presented as follows:
Central Pivot Point – 2.1151
R1 – 2.1349
R2 – 2.1718
R3 – 2.1916
S1 – 2.0782
S2 – 2.0584
S3 – 2.0215


