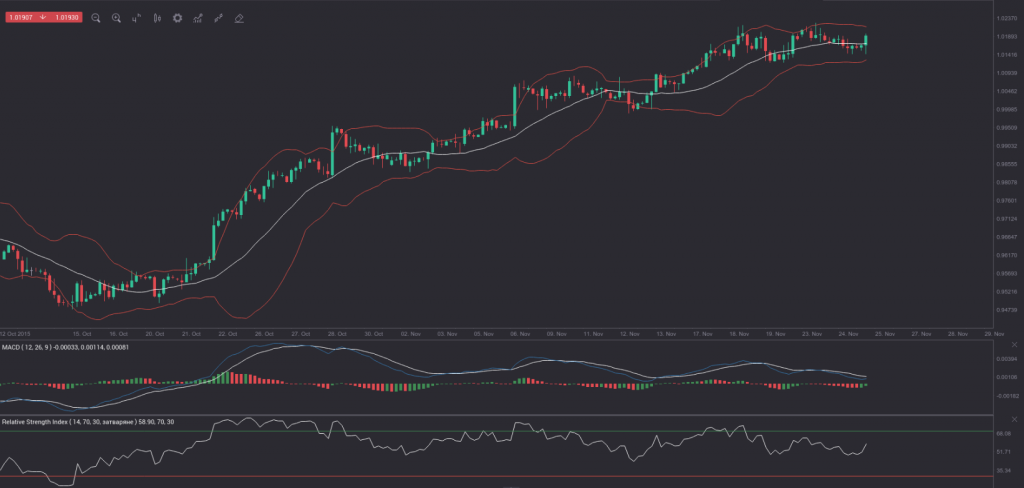
Yesterday’s trade saw USD/CHF within the range of 1.0140-1.0197. The pair closed at 1.0172, shedding 0.13% on a daily basis, while extending losses from Monday. The daily low has been the lowest level since November 20th, when the cross registered a low of 1.0110. In weekly terms, USD/CHF went up 1.19% last week, marking its fourth gain in the past five weeks.
At 9:44 GMT today USD/CHF was gaining 0.32% for the day to trade at 1.0200. The pair touched a daily high at 1.0209 at 9:37 GMT.
Technical Outlook
The pair broke out from a tight four-bar trading range, penetrating the middle Bollinger line, and is set to test the upper boundary. The 14-period RSI has moved above its 50.00 level, while the MACD is about to generate a bullish signal, when its main line crosses the signal line in a bottom-up manner. Resistance may be encountered in the area around November 23rd high (1.0227), when USD/CHF advance has been halted on several occasions in the past few trading days. It has been the highest level since January 14th, when the pair went up as high as 1.0241. In case a break above November 23rd high is observed, USD/CHF may target the high from January 14th. At the same time, the area around 1.0140 represents a zone of support.
Daily and Weekly Pivot Levels
By employing the Camarilla calculation method, the daily pivot levels for USD/CHF are presented as follows:
R1 – 1.0177
R2 – 1.0182
R3 (range resistance) – 1.0188
R4 (range breakout) – 1.0203
S1 – 1.0167
S2 – 1.0161
S3 (range support) – 1.0155
S4 (range breakout) – 1.0141
By using the traditional method of calculation, the weekly pivot levels for USD/CHF are presented as follows:
Central Pivot Point – 1.0150
R1 – 1.0261
R2 – 1.0334
R3 – 1.0445
S1 – 1.0077
S2 – 0.9966
S3 – 0.9893


