According to a May 2nd report by General Motors Company (GM), new vehicle sales in the United States dropped 6% to 244 406 units in April. On the other hand, sales of crossovers and trucks continued to increase during the month, which added to recent tendency among consumers to avoid cars in favor of bigger vehicles.
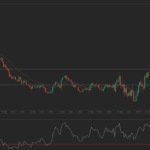
General Motors shares registered their largest daily loss since April 3rd during Tuesdays trading session. The stock went down 2.92% ($1.00) to $33.20, after touching an intraday low at $32.82, or a price level not seen since November 22nd 2016 ($32.77). In the week ended on April 30th the shares of the largest vehicle manufacturer in the United States added 2.64% to their market value compared to a week ago, which marked a second consecutive period of gains and also the best performance since the week ended on March 5th. However, the stock has extended its loss to 4.16% so far during the current month, following a 2.04% drop in April. The latter has been a second consecutive month of share price decline. For the entire past year, General Motors shares added 2.44%.
Last month, sales of Chevrolet crossovers surged 27% on a retail basis. In addition, crossover sales at the Buick brand went up 48%, those at GMC rose 20%, while sales at Cadillac soared 46%.
“We see crossovers becoming an even bigger part of the industry and GM sales over the next five years”, Kurt McNeil, US vice president of Sales Operations, said. “Just five years ago, about one in four GM sales were crossovers. Today, they account for almost one-third of our deliveries and we see more growth ahead.”
According to the auto maker, the average vehicle transaction price went up during the first quarter of the year, while consumer discounts equaled 11.7% of the transaction cost.
At the same time, GM’s inventory level was reported to have increased to 100 days of supply as of the end of last month. In comparison, the company’s inventory level equaled 70 days of supply as of the end of December.
GM has already pledged to reduce its inventory level by the end of this year.
According to CNN Money, the 22 analysts, offering 12-month forecasts regarding GM’s stock price, have a median target of $40.00, with a high estimate of $51.00 and a low estimate of $31.00. The median estimate is a 20.48% surge compared to the closing price of $33.20 on May 2nd.
The same media also reported that 13 out of 24 surveyed investment analysts had rated General Motors’ stock as “Hold”, while 9 – as “Buy”. On the other hand, 1 analyst had recommended selling the stock.
Daily and Weekly Pivot Levels
With the help of the Camarilla calculation method, todays levels of importance for the General Motors stock are presented as follows:
R1 – $33.34
R2 – $33.48
R3 (Range Resistance – Sell) – $33.62
R4 (Long Breakout) – $34.04
R5 (Breakout Target 1) – $34.52
R6 (Breakout Target 2) – $34.74
S1 – $33.06
S2 – $32.92
S3 (Range Support – Buy) – $32.78
S4 (Short Breakout) – $32.36
S5 (Breakout Target 1) – $31.88
S6 (Breakout Target 2) – $31.66
By using the traditional method of calculation, the weekly levels of importance for General Motors Company (GM) are presented as follows:
Central Pivot Point – $34.52
R1 – $35.41
R2 – $36.18
R3 – $37.07
R4 – $37.96
S1 – $33.75
S2 – $32.86
S3 – $32.09
S4 – $31.32


