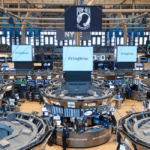
Goldman Sachs Group Incs (GS) second-quarter earnings, reported on Tuesday, exceeded market expectations due to strength in investment banking as well as in fixed income trading.
Goldman Sachs shares closed lower for the fourth time in the past nine trading sessions in New York on Tuesday. The stock edged down 0.18% ($0.42) to $231.02, after touching an intraday high at $233.23, or a price level not seen since June 14th ($235.89).
Shares of Goldman Sachs Group Inc have retreated 9.32% so far in 2018 compared with a 5.08% gain for the underlying index, S&P 500 (SPX).
In 2017, Goldman Sachs’s stock rose 6.39%, thus, it again underperformed the S&P 500, which registered a 19.42% return.
The groups total revenue went up 18.3% to $8.40 billion during the second quarter ended on June 30th from a year ago, as revenue from its investment banking business grew 18%.
At the same time, the banks revenue from trading operations surged 17% year-on-year to $3.57 billion during the latest quarter, supported by a 45% revenue growth in fixed income trading.
On the other hand, revenue from equities trading remained almost without change in Q2 compared to the same period a year ago.
Goldman Sachs’s net income attributable to shareholders went up to $2.35 billion ($5.98 per share) during the quarter ended on June 30th, from $1.63 billion ($3.95 per share) in the year-ago quarter. In comparison, the median estimate by analysts had pointed to earnings of $4.46 per share.
Meanwhile, David Solomon, who currently serves as Chief Operating Officer, has been appointed as the groups new Chief Executive Officer, succeeding Lloyd Blankfein. Solomon is expected to assume the new role at the beginning of October, while Blankfein will keep the Chairman position until the end of the year.
According to CNN Money, the 27 analysts, offering 12-month forecasts regarding Goldman Sachs’s stock price, have a median target of $278.00, with a high estimate of $330.00 and a low estimate of $200.00. The median estimate represents a 20.34% upside compared to the closing price of $231.02 on July 17th.
The same media also reported that 14 out of 29 surveyed investment analysts had rated Goldman Sachs’s stock as “Hold”, while 9 – as “Buy”. On the other hand, 2 analysts had recommended selling the stock.
Daily and Weekly Pivot Levels
With the help of the Camarilla calculation method, todays levels of importance for the Goldman Sachs stock are presented as follows:
R1 – $231.60
R2 – $232.19
R3 (Range Resistance – Sell) – $232.77
R4 (Long Breakout) – $234.52
R5 (Breakout Target 1) – $236.56
R6 (Breakout Target 2) – $237.50
S1 – $230.44
S2 – $229.85
S3 (Range Support – Buy) – $229.27
S4 (Short Breakout) – $227.52
S5 (Breakout Target 1) – $225.48
S6 (Breakout Target 2) – $224.54
By using the traditional method of calculation, the weekly levels of importance for Goldman Sachs Group Inc (GS) are presented as follows:
Central Pivot Point – $226.09
R1 – $229.19
R2 – $231.96
R3 – $235.06
R4 – $238.15
S1 – $223.32
S2 – $220.22
S3 – $217.45
S4 – $214.67


