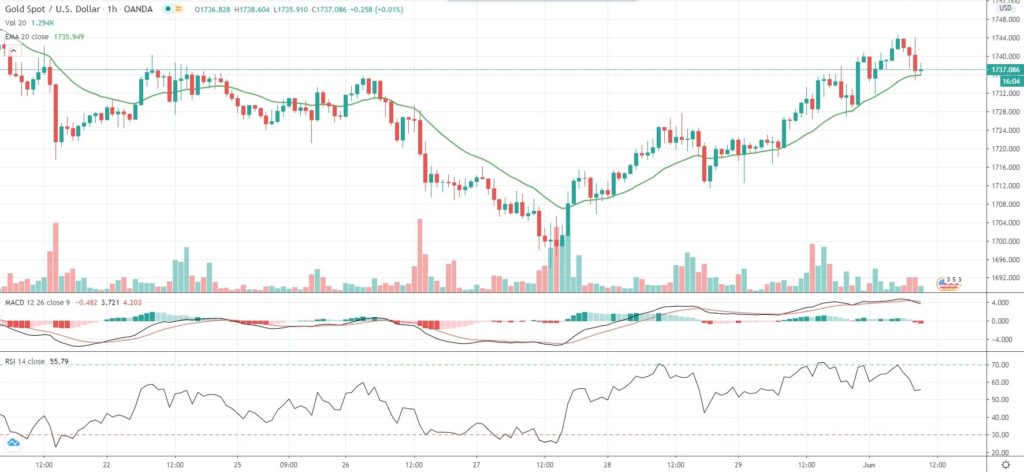
Gold prices rose for a third straight day on Monday, reaching highs unseen since May 21st, on weaker US Dollar and as unrest in major cities across the United States and rising tensions between Beijing and Washington over Hong Kong triggered a rush to safe haven assets.
The streets of major US cities have been flooded by protesters after the death of George Floyd, 46-year old African-American, during a police arrest outside a shop in Minneapolis. With crowds closely packed and demonstrators being without masks, concerns were raised that the COVID-19 disease could re-emerge after claiming the lives of more than 100,000 US citizens.
Meanwhile, over the weekend China’s state media and the Hong Kong government condemned US President Trump’s pledge to “take action to revoke Hong Kong’s preferential treatment as a separate customs and travel territory”, and to impose sanctions on unnamed individuals following the approval of China’s national security legislation on the major Asian financial hub.
As of 9:41 GMT on Monday Spot Gold was gaining 0.45% to trade at $1,737.27 per troy ounce, after touching an intraday high of $1,744.69 during late Asian trade, or a price level not seen since May 21st ($1,749.06). Meanwhile, Gold futures for delivery in August were down 0.14% on the day to trade at $1,749.30 per troy ounce, while Silver futures for delivery in July were up 1.04% to trade at $18.692 per troy ounce.
The US Dollar Index, which reflects the relative strength of the greenback against a basket of six other major currencies, was retreating 0.28% on Monday to 98.01, after touching an intraday low at 97.85, or a level not seen since March 16th (97.45).
In terms of macroeconomic calendar, today gold traders will be eyeing the monthly report on US factory activity by the Institute for Supply Management, due out at 14:00 GMT. Activity in United States’ manufacturing industry probably contracted for a third consecutive month in May, with the respective Purchasing Managers’ Index coming in at a reading of 43.0, according to market expectations. In April, the gauge was reported at 41.5, indicating the steepest rate of contraction since April 2009.
Meanwhile, near-term interest rate expectations were unchanged. According to CME’s FedWatch Tool, as of June 1st, investors saw a 100.0% chance of the Federal Reserve keeping borrowing costs at the current 0%-0.25% level at its policy meeting on June 9th-10th, or unchanged compared to May 29th.
Daily Pivot Levels (traditional method of calculation)
Central Pivot – $1,726.72
R1 – $1,740.81
R2 – $1,752.01
R3 – $1,766.10
R4 – $1,780.20
S1 – $1,715.52
S2 – $1,701.43
S3 – $1,690.23
S4 – $1,679.03


