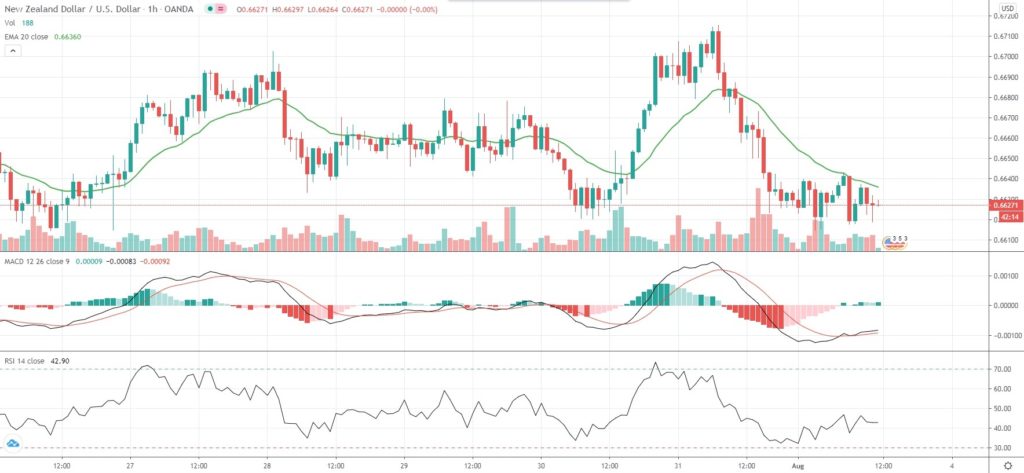
NZD/USD came off Friday’s seven-month high and traded within a relatively tight range on Monday, as the US Dollar rebounded after recording its biggest monthly decline in a decade in July against a basket of six other major currencies.
The latest data by the US Commodity Futures Trading Commission showed net short positions in the US Dollar had surged to a level not seen since August 2011, to $24.27 billion. Analysts attributed the greenback’s recent rally against peers to a partial squeezing out of those short positions as well as to escalating US-China geopolitical tensions.
The US Dollar Index was gaining 0.35% on the day to 93.78 on Monday, after retreating 4.03% in July, its worst performance since September 2010.
“The factors that have seen DXY (the dollar index) fall 10% from its spike high in March are still in place and we expect a ‘sell the rally’ mentality to develop through August,” ING strategists wrote in an investor note.
Concerns over US outlook mounted after policy makers did not manage to reach an agreement on providing additional stimulus for the coronavirus-ravaged economy even as an expanded $75-billion-per-month unemployment benefit expired on July 31st. White House Chief of Staff Mark Meadows said over the past weekend that he was skeptical about reaching a near-term agreement on a coronavirus relief bill.
“We’ll also be focusing on (the U.S.) Congress, where the $600 per month unemployment benefit boost has now expired and the parties are wrangling over the design of the Phase IV stimulus package. Delays here may upset asset markets, which typically tend to struggle a little more in August,” ING strategists noted.
As of 11:16 GMT on Monday NZD/USD was inching down 0.02% to trade at 0.6628, while moving within a daily range of 0.6615-0.6643. On Friday it climbed as high as 0.6716, or its strongest level since January 2nd (0.6739). The major pair advanced 2.70% in July, which marked its fourth straight month of gains.
On today’s economic calendar, activity in United States’ manufacturing industry probably expanded for a second consecutive month in July, with the respective Purchasing Managers’ Index coming in at a reading of 54.0, according to market expectations. In June, the gauge was reported at 52.6, indicating the sharpest rate of expansion since April 2019, as the sub-indexes of new orders, production and prices rebounded, while those of employment and new export orders dropped at a softer rate. The Institute for Supply Management is to release the official report at 14:00 GMT.
Kiwi traders will be also expecting the latest unemployment data from New Zealand due out at 22:45 GMT on Tuesday. The rate of unemployment is expected to surge to 5.8% during the second quarter from 4.2% in Q1, while employment is expected to shrink at a quarterly rate of 2% in Q2.
Bond Yield Spread
The spread between 1-year New Zealand and 1-year US bond yields, which reflects the flow of funds in a short term, equaled 13.9 basis points (0.139%) as of 10:15 GMT on Monday, or unchanged compared to July 31st.
Daily Pivot Levels (traditional method of calculation)
Central Pivot – 0.6656
R1 – 0.6689
R2 – 0.6748
R3 – 0.6781
R4 – 0.6814
S1 – 0.6597
S2 – 0.6564
S3 – 0.6505
S4 – 0.6445


