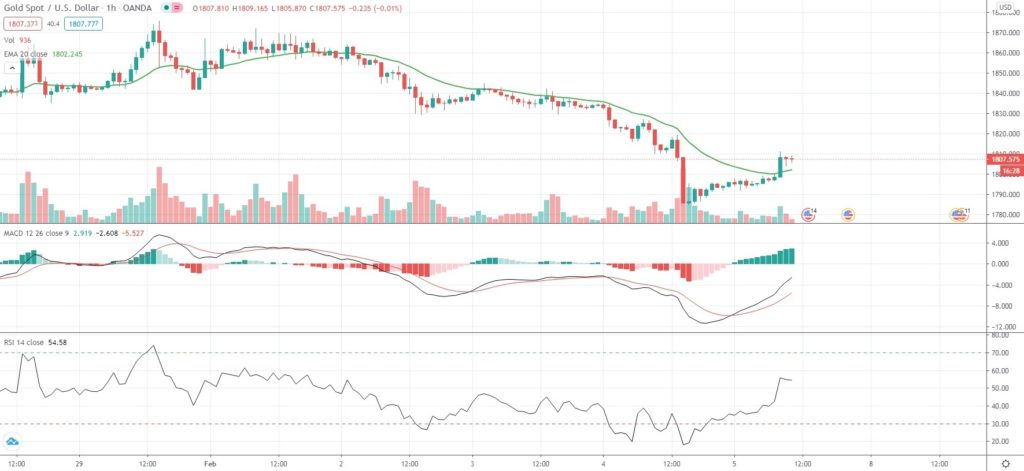
Having touched a two-month low on Thursday, Spot Gold managed to recoup part of recent losses on Friday, as the US Dollar eased from highs unseen since early December. Still, however, the yellow metal looked set to register its steepest weekly decline since the business week ended on January 8th, being down 2.20%.
“There is some technical rebound as investors think Thursday’s drop was overdone, but overall trend in gold remains bearish on rising dollar and yields,” Margaret Yang, DailyFX strategist, said.
“The economic outlook is definitely brighter with vaccines bringing down daily COVID-19 infections, and the macro data is improving, undermining the demand for precious metals as a store of value,” she added.
“Gold is about to endure some serious short-term pain,” Jeffrey Halley, senior market analyst at OANDA, warned, while also noting that the metal’s role as a hedge against inflation will come back as soon as economic recovery begins to pick up pace by late second quarter.
As of 10:41 GMT on Friday Spot Gold was advancing 0.75% to trade at $1,807.40 per troy ounce, while moving within a daily range of $1,792.13-$1,811.32 per troy ounce. Yesterday the precious metal slipped as low as $1,785.02, or its weakest price level since December 1st 2020 ($1,775.90 per troy ounce). The commodity retreated 2.67% in January.
Meanwhile, Gold futures for delivery in April were gaining 0.92% on the day to trade at $1,807.65 per troy ounce, while Silver futures for delivery in March were up 1.99% to trade at $26.755 per troy ounce.
The US Dollar Index, which reflects the relative strength of the greenback against a basket of six other major currencies, was edging down 0.15% to 91.39 on Friday, after earlier touching 91.60, or its strongest level since December 1st 2020 (91.94).
In terms of macroeconomic data, today Gold traders will be paying attention to the January report on US Non-Farm Payrolls, Unemployment Rate and Average Hourly Earnings due out at 13:30 GMT.
Daily Pivot Levels (traditional method of calculation)
Central Pivot – $1,804.61
R1 – $1,824.20
R2 – $1,854.41
R3 – $1,874.00
R4 – $1,893.60
S1 – $1,774.40
S2 – $1,754.81
S3 – $1,724.60
S4 – $1,694.40


