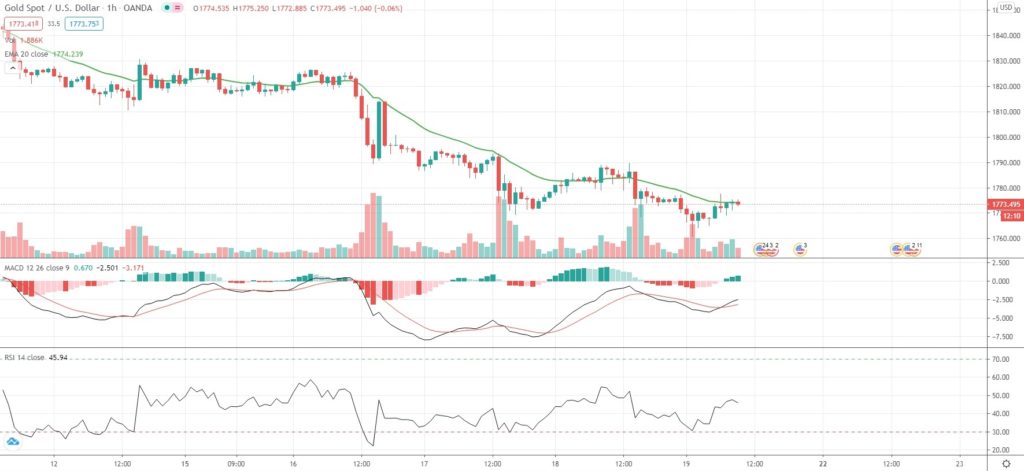
Spot Gold extended losses from the prior several trading days on Friday, while hitting a fresh 33-week trough, as the recent surge in US bond yields continued to weigh on demand for the safe-haven metal.
Gold also looked set to register its biggest weekly loss since late November, being down 2.74%.
The yield on 10-year US government bonds rose to levels not seen in almost a year earlier this week. Higher bond yields lead to higher opportunity cost of holding the non-yielding precious metal.
Despite pulling back from recent highs, the US Dollar Index was also poised for a weekly advance. A stronger US Dollar tends to make Gold more expensive for international investors holding other currencies.
In other news, the latest customs data showed that Switzerland’s gold exports to India had risen to their highest level since May 2019 in January, while exports of the commodity to China and Hong Kong were still at rock bottom.
As of 10:12 GMT on Friday Spot Gold was edging down 0.30% to trade at $1,770.63 per troy ounce, after earlier touching an intraday low of $1,760.75 per troy ounce, or its weakest price level since July 2nd 2020 ($1,757.66 per troy ounce). The commodity has retreated 3.96% so far in February, following another 2.67% drop in January.
Meanwhile, Gold futures for delivery in April were edging down 0.29% on the day to trade at $1,769.85 per troy ounce, while Silver futures for delivery in March were up 0.20% to trade at $27.133 per troy ounce.
The US Dollar Index, which reflects the relative strength of the greenback against a basket of six other major currencies, was edging down 0.29% to 90.33 on Friday, while extending a pullback from Wednesday’s over one-week high of 91.06.
Near-term investor interest rate expectations were without change. According to CME’s FedWatch Tool, as of February 19th, investors saw a 100.0% chance of the Federal Reserve keeping borrowing costs at the current 0%-0.25% level at its policy meeting on March 16th-17th, or unchanged compared to February 18th.
Daily Pivot Levels (traditional method of calculation)
Central Pivot – $1,778.01
R1 – $1,787.55
R2 – $1,799.23
R3 – $1,808.77
R4 – $1,818.31
S1 – $1,766.33
S2 – $1,756.79
S3 – $1,745.11
S4 – $1,733.43


