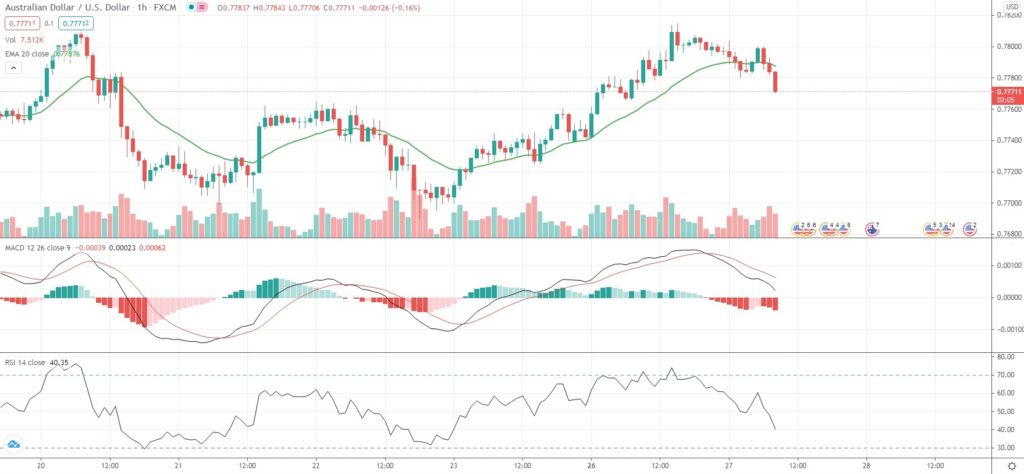
AUD/USD, a liquid proxy for risk, eased from a one-week high on Tuesday, as market players abstained from taking large positions ahead of the Federal Reserve’s two-day policy meeting.
Yesterday the Aussie dollar appreciated to 0.7815 against its US counterpart, a level not seen since April 20th, supported by near-record high prices of iron ore. Some analysts expect higher commodity prices to remain a key catalyst for the Australian currency in the near future.
“The close above 0.7790 is an important one and, if sustained, suggests that this move can extend towards the February highs at 0.80,” Westpac Banking Corp strategists wrote in an investor note.
Meanwhile, the US Dollar remained stuck in a narrow range, not far from an eight-week trough against a basket of six major peers, with the DXY being up 0.17% to 91.000 on Tuesday.
“The dollar doesn’t seem to have the strength it had earlier this year,” said Kyosuke Suzuki of Ryobi Systems.
“It had been driven by various expectations, such as massive fiscal spending and speedy vaccinations in the States. Most of those appear to have been priced in.”
Yesterday US intermediate-dated government bond yields surged following a $121 billion bond sale by the Treasury Department. At the same time, US 10-year bond yields went up 1 basis point to 1.570% on Tuesday, while Australian 10-year bond yields also rose 1 basis point to 1.690%.
As of 8:52 GMT on Tuesday AUD/USD was edging down 0.33% to trade at 0.7772, while moving within a daily range of 0.7770-0.7804. The major currency pair has gained 2.35% so far in April, following a 1.45% drop in March. AUD/USD was on track to register its best monthly performance since December 2020.
Bond Yield Spread
The spread between 2-year Australian and 2-year US bond yields, which reflects the flow of funds in a short term, equaled -10.29 basis points (-0.1029%) as of 8:15 GMT on Tuesday, down from -9.7 basis points on April 26th.
Daily Pivot Levels (traditional method of calculation)
Central Pivot – 0.7784
R1 – 0.7829
R2 – 0.7860
R3 – 0.7905
R4 – 0.7951
S1 – 0.7753
S2 – 0.7708
S3 – 0.7677
S4 – 0.7646


