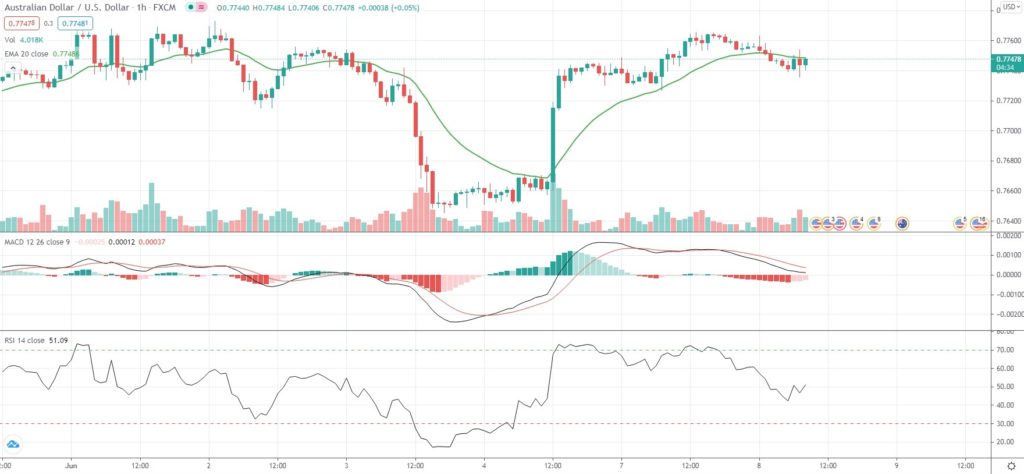
AUD/USD edged down on Tuesday since uncertainty surrounding the Federal Reserve’s policy outlook seemed to have offset upbeat macro data coming out of Australia.
A softer-than-anticipated US Non-Farm Payrolls report somewhat allayed fears of an early monetary policy tightening by the Fed, which helped the Aussie to recoup earlier losses last week.
Next, on the investors’ radar is the May report on US consumer price inflation, due out on Thursday, with a high reading seen as supporting the US Dollar.
Meanwhile, macro data earlier on Tuesday showed that business activity in Australia had risen to all-time highs last month and there was also positive news about the COVID-19 situation in Victoria. Pandemic-related restrictions in Melbourne, the second-most populous city in Australia, are likely to be relaxed on Friday.
The latest data added to the case that the Reserve Bank of Australia (RBA) will probably take the first minor step towards monetary support tapering in July. The majority of analysts project that the central bank will not roll over the three-year bond yield target of 0.10% from the April 2024 bond to the November 2024 maturity, but will probably announce another round of bond purchases.
“We have been forecasting an A$50-75 billion purchase pace over 4Q21/1Q22 as a compromise measure, given that on our forecasts the Fed’s tapering discussion would be reasonably advanced by September,” Ben Jarman, an interest rate strategist at J.P. Morgan, was quoted as saying by Reuters.
The RBA’s current AUD 100 billion bond-purchasing package is to end in September.
As of 8:42 GMT on Tuesday AUD/USD was edging down 0.12% to trade at 0.7745, while moving within a daily range of 0.7736-0.7763. Last Thursday the pair slipped as low as 0.7645, which has been its weakest level since April 14th (0.7634). The major currency pair has risen 0.23% so far in June, following another 0.26% gain in May.
Bond Yield Spread
The spread between 2-year Australian and 2-year US bond yields, which reflects the flow of funds in a short term, equaled -9.67 basis points (-0.0967%) as of 8:15 GMT on Tuesday, up from -9.9 basis points on June 7th.
Daily Pivot Levels (traditional method of calculation)
Central Pivot – 0.7749
R1 – 0.7771
R2 – 0.7788
R3 – 0.7810
R4 – 0.7832
S1 – 0.7732
S2 – 0.7710
S3 – 0.7693
S4 – 0.7676


