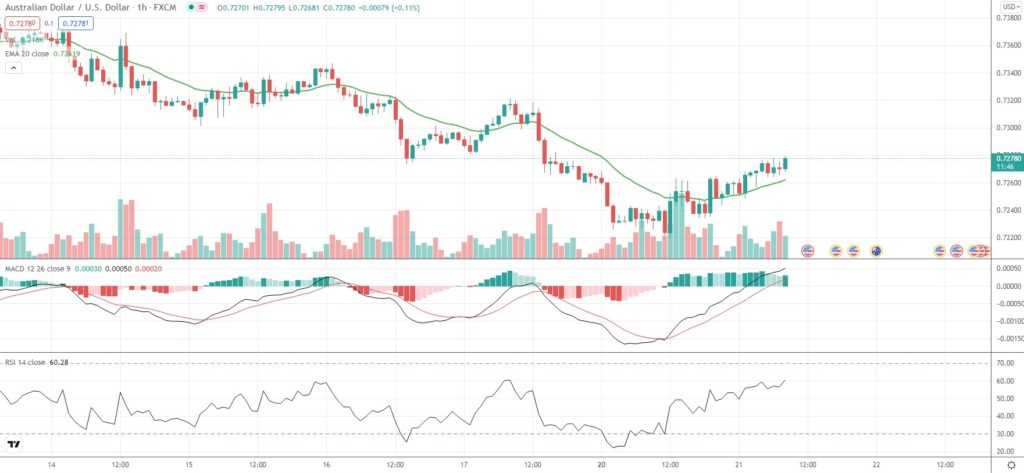
AUD/USD snapped a three-day streak of losses on Tuesday, while tracking a rally in crude oil prices and despite overall risk-averse mood. Yesterday the Aussie slipped to a fresh one-month low against its US counterpart, as the risk of a potential default by property developer China Evergrande heightened, causing a flight to safety in the markets.
“It feels like the market was waiting on something from the Chinese authorities over the weekend to calm the markets and ring-fence the contagion worries from a looming Evergrande default, and that didn’t come,” Chris Weston, head of research at Melbourne-based Pepperstone, wrote in a note to clients.
“Traders sense a credit event is coming,” he added.
Meanwhile, the Minutes of the Reserve Bank of Australia’s policy meeting in September showed that the outbreak of the Delta variant of the virus had disrupted economic recovery in a more severe manner than expected a month earlier.
“GDP was expected to decline materially in Q3; the near-term outlook resembled the downside scenario presented in the most recent forecasts,” the Minutes stated.
Still, RBA policy makers expect the Australian economy to return to its pre-Delta path by mid-2022.
The US Dollar was mostly steady against a basket of six major peers on Tuesday, not far from yesterday’s one-month peak, on expectations the Federal Reserve will probably signal a beginning of bond-purchase tapering at its two-day policy meeting to be concluded tomorrow.
As of 8:37 GMT on Tuesday AUD/USD was edging up 0.36% to trade at 0.7275, while moving within a daily range of 0.7244-0.7279. Yesterday the Forex pair went down as low as 0.7220, which has been its weakest level since August 24th (0.7201). The major currency pair has retreated 0.49% so far in September, following another 0.39% loss in August.
Bond Yield Spread
The spread between 2-year Australian and 2-year US bond yields, which reflects the flow of funds in a short term, equaled -20.19 basis points (-0.2019%) as of 8:15 GMT on Tuesday, down from -19.4 basis points on September 20th.
Daily Pivot Levels (traditional method of calculation)
Central Pivot – 0.7246
R1 – 0.7272
R2 – 0.7294
R3 – 0.7320
R4 – 0.7346
S1 – 0.7223
S2 – 0.7198
S3 – 0.7175
S4 – 0.7153


