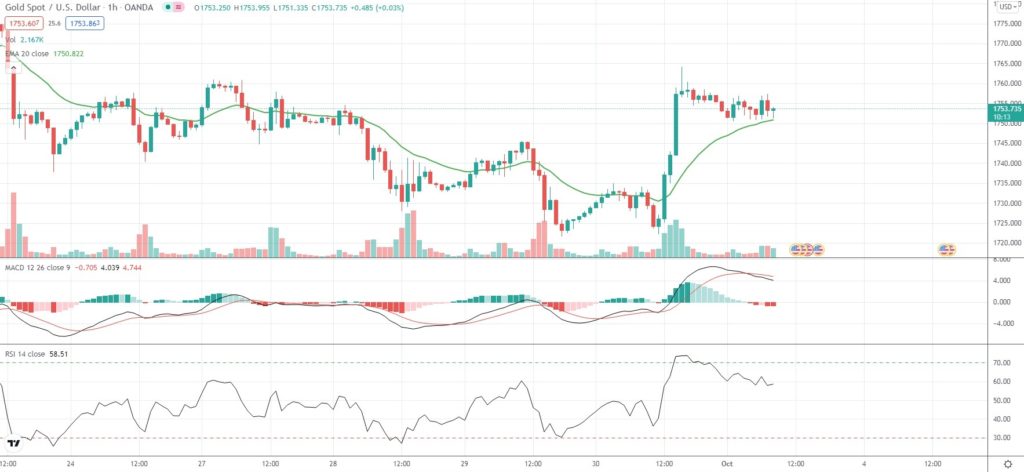
Spot Gold eased from a one-week peak on Friday, as the US Dollar hovered just below a fresh one-year high, mounting pressure on the dollar-priced commodity.
A stronger dollar makes Gold more expensive for international investors holding other currencies.
Still, a drop in US 10-year Treasury yields limited losses for the yellow metal.
“The gold market is starting to realize the Fed may not be as hawkish as priced in for the speed of tapering and subsequent rate hikes, especially with recent changes in the FOMC,” Stephen Innes, managing partner at SPI Asset Management, said as he referred to the recent retirement of two Federal Reserve officials.
A reduction in monetary stimulus and interest rate hikes would bolster Treasury yields and increase the opportunity cost of holding non-yielding Gold.
Market focus now sets on US PCE inflation numbers due out later on Friday as well as on the ISM Manufacturing report.
As of 8:47 GMT on Friday Spot Gold was edging down 0.24% to trade at $1,752.82 per troy ounce. Yesterday the precious metal went up as high as $1,764.24 per troy ounce, which has been its strongest price level since September 23rd ($1,776.63).
Gold looked set to register its fourth straight week of losses, while being down 0.18%. The yellow metal retreated 3.13% in September, which has been its worst performance since June.
Meanwhile, Gold futures for delivery in December were edging down 0.29% on the day to trade at $1,751.95 per troy ounce, while Silver futures for delivery in December were up 0.66% to trade at $22.192 per troy ounce.
The US Dollar Index, which reflects the relative strength of the greenback against a basket of six other major currencies, was inching up 0.08% to 94.315 on Friday. In the previous trading session, the DXY climbed as high as 94.503, which has been its strongest level since September 28th 2020 (94.636).
Near-term investor interest rate expectations were little changed. According to CME’s FedWatch Tool, as of October 1st, investors saw a 99.5% chance of the Federal Reserve keeping borrowing costs at the current 0%-0.25% level at its policy meeting on November 2nd-3rd, compared to a 100% chance on September 30th.
Daily Pivot Levels (traditional method of calculation)
Central Pivot – $1,747.86
R1 – $1,773.42
R2 – $1,789.81
R3 – $1,815.37
R4 – $1,840.94
S1 – $1,731.47
S2 – $1,705.91
S3 – $1,689.52
S4 – $1,673.14


