In 2024, home prices in the U.S. continued to soar to record highs driven by inflation and sustained demand from prospective buyers and investors. Mortgages remained expensive despite the three interest rate cuts introduced by the Fed over the past few months. With prices painfully high, buying a home remains almost impossible for many Americans. For the younger generations who have little to no savings and earn minimum to average wage, in particular, the American dream of owning your own home is still out of reach.
With median house prices now being nearly six times the median annual income, some experts have described 2024’s homebuying season as a “tough one” due to the high mortgage rates and rising home prices. Eager to find where people struggle to afford a home the most, the team at TradingPedia analyzed 2024 and 2025 housing market data obtained from Redfin, along with personal income statistics, sourced by the U.S. Bureau of Economic Analysis for the third quarter of the same year. We calculated how many annual incomes it would cost the average American to buy a house in every state across the country, which allowed us to rank the states from least to most affordable.
We found out that even with the home affordability crisis gripping the U.S. real estate market, certain states offer relatively accessible housing alternatives when we look at home prices relative to personal income. To get a more visual representation of the pricing, we created a map illustrating the income per capita as a percentage of the median home price in every state. A higher percentage and a darker shade on the heatmap indicate a more balanced correlation between home price and income and vice versa.
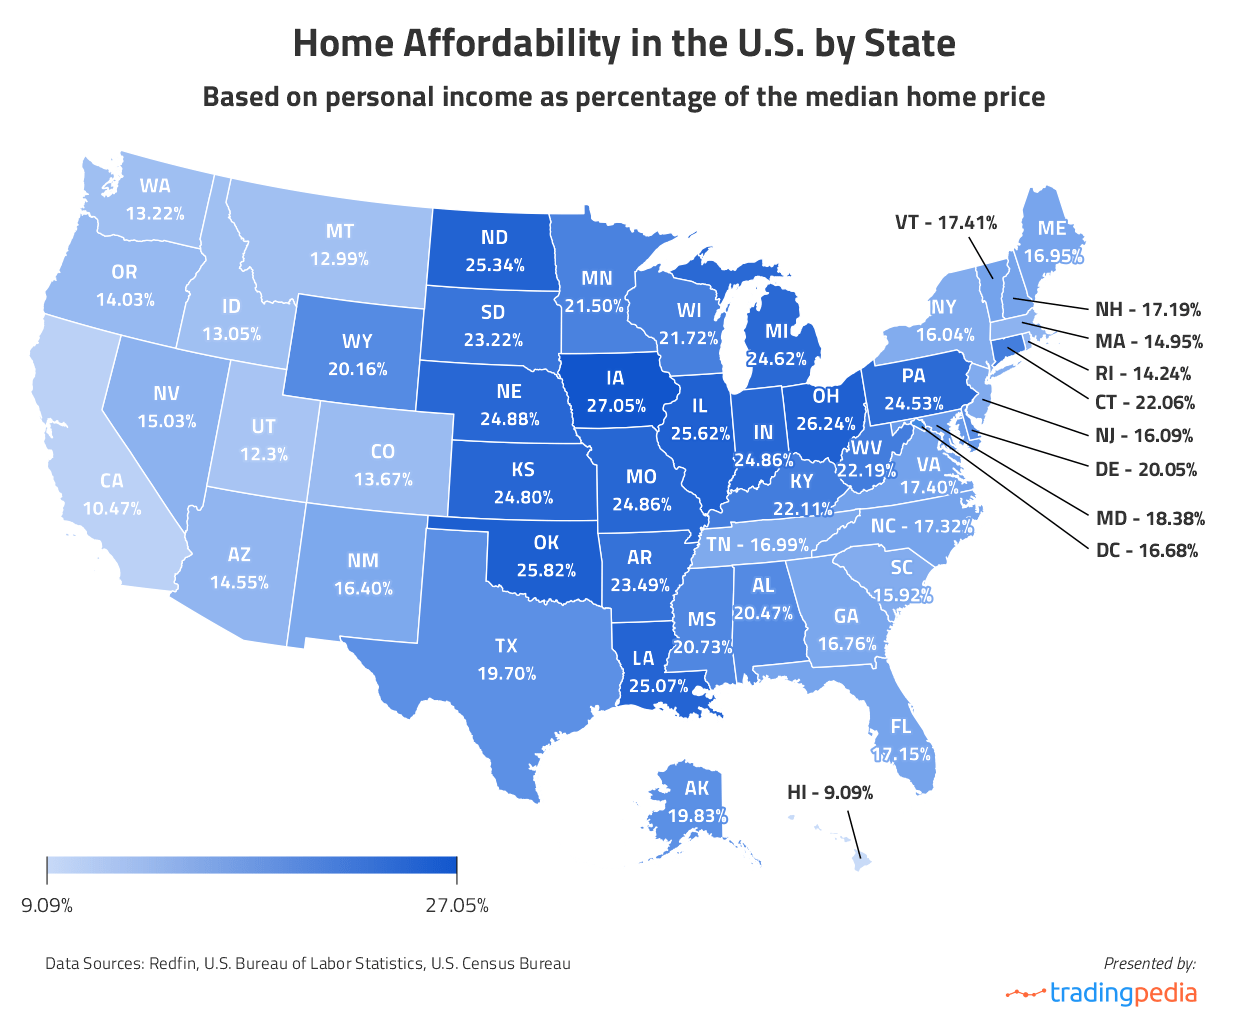
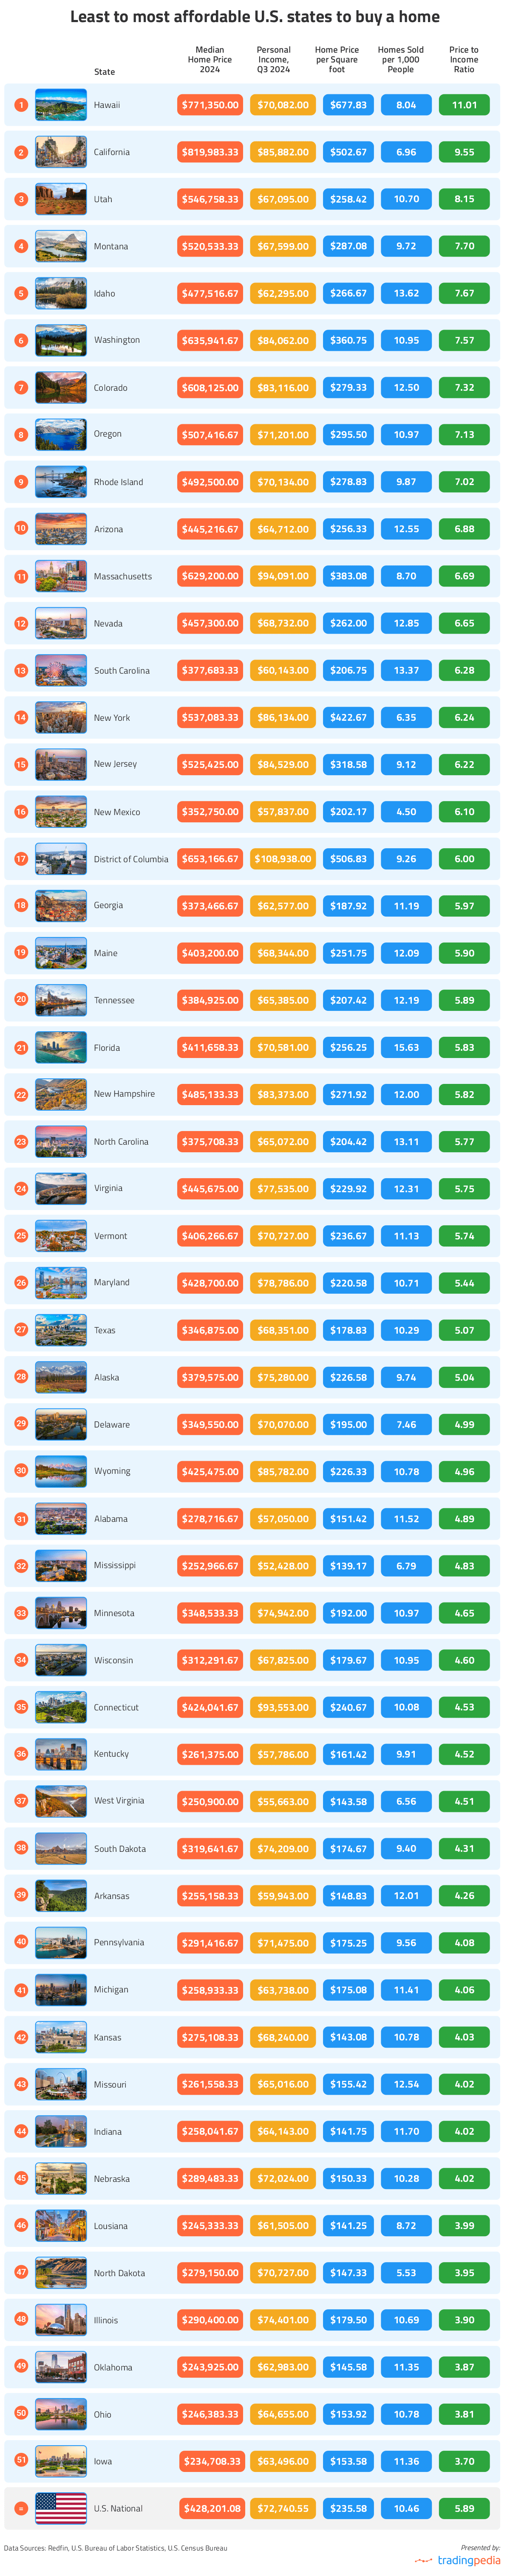
Although Californians grapple with the highest median home sale price in the country ($819,983), those living in Hawaii face even worse levels of home affordability, our findings show. Residents of the Aloha State earn an annual income of $70,082 on average, which is barely 9.09% of the median home’s price there ($771,350). As a result, homebuyers would need to set aside over 11 years’ worth of earnings should they opt to buy a house with cash.
Meanwhile, Iowa residents enjoy the most affordable housing market, with the average annual income ($63,496/year) covering as much as 27% of the cost of a typical home ($234,708). In other words, they would need to save their earnings for only 3 years and 8 months to be able to afford one. Ohio follows as the second most accessible market with an annual income of $64,655, which accounts for 26.24% of the amount required to purchase a home ($246,383).
What Is Personal Income And Personal Income per Capita?
Government agencies use a wide variety of statistical measures to describe residents’ earnings, with wages and salaries being the most commonly known. For this analysis, we used the so-called “personal income”, which is the income people receive from all sources, including wages and salaries, from business ownership, from rents, dividends and interest, from Social Security and other government benefits. It includes income from domestic and international sources but does not include realized or unrealized capital gains or losses. Note that personal income does not equal another frequently used term, “disposable income”, so it is the income before taxes are paid.
To calculate the per capita personal income, we took the total personal income of the residents of a state and divided it by the state population. All data was sourced from the U.S. Bureau of Economic Analysis and the U.S. Census Bureau.
Home Price vs. Personal Income: Most to Least Affordable U.S States
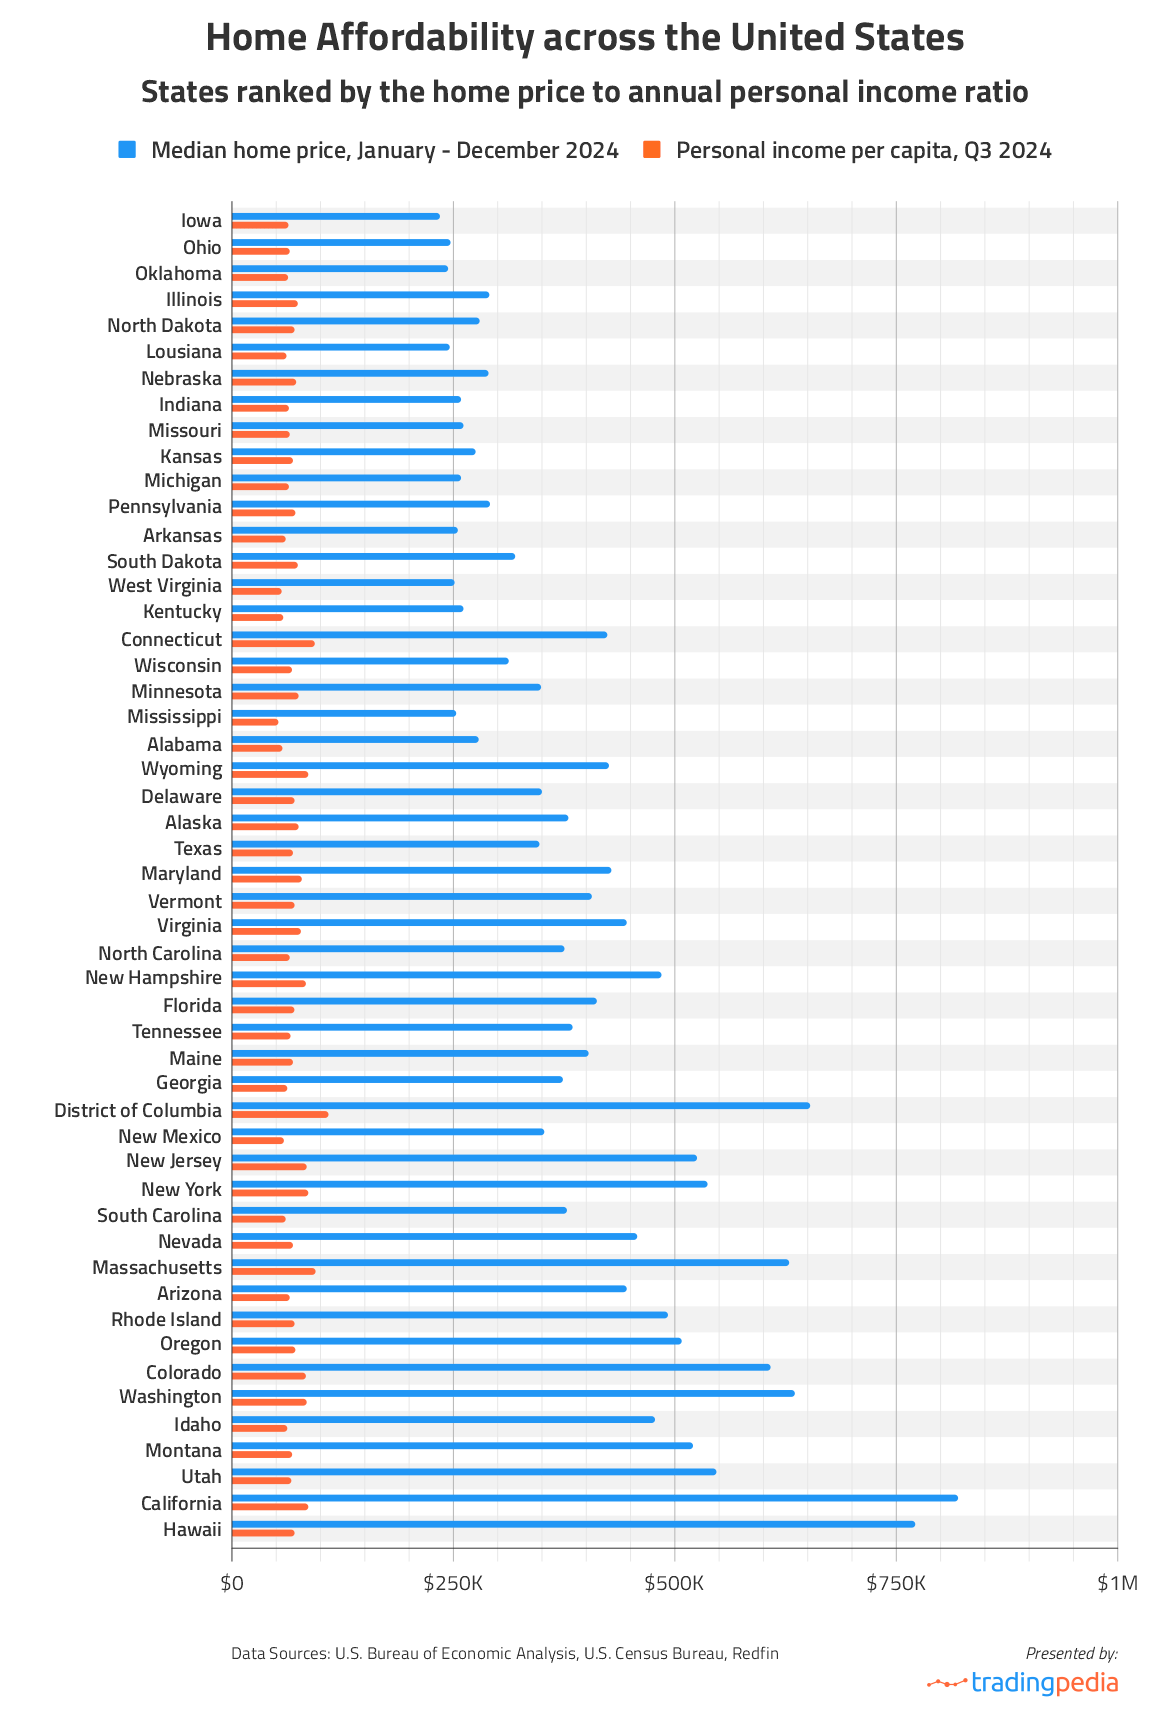
According to our findings, the U.S. median home price reached $428,201 last year, while the income per capita stood at $72,741 as of the third quarter. This translates to the median house costing about six times a person’s annual income.
Those hoping to finally buy a house this year might find success in the Midwest, as 8 out of the 10 most affordable states, except for Oklahoma and Louisiana, are Midwestern. With median home prices way under $300,000, these states make homeownership attainable for many, especially since the annual income per capita there has surpassed $60,000 according to the U.S. Bureau of Economic Analysis. At the other end of the spectrum, homes in the states with the highest home price-to-income ratio, predominantly in the West, are far beyond the means of most Americans, including the ones residing within them.
Interestingly, residents of the District of Columbia enjoy the highest per capita income in the country ($108,938/year) but this doesn’t necessarily equate to increased home affordability. According to our calculations, it would take them 6 years worth of income before they have saved enough to afford a home ($653,167).
North Dakota, despite being the 5th most affordable state for house seekers, recorded the lowest number of home sales in 2024 (4,402) and the second-lowest figure when we consider sales per 1,000 people (5.5), standing above only New Mexico (4.5). Meanwhile, Florida stands among the not-so-affordable U.S. housing markets with a home price-to-income ratio of 5.83, which is close to the national average of 5.89. However, it witnessed the highest number of home sales last year (365,377) and lead in sales per thousand people, with a figure standing at 15.63 sold homes per 1,000 residents. The most populous state, California, remains third after Florida and Texas when it comes to the number of homes sold in 2024 (274,552). Between January 1 and December 31, 2024, a total of 322,108 sales were completed in Texas.
It is also interesting to compare the prices per square footage for residential real estate across the United States. The cheapest properties according to this metric are in the state of Mississippi ($139.17 per sq.ft), followed by those in Louisiana ($141.25 per sq.ft), Indiana ($141.25 per sq.ft), Kansas ($143.08 per sq.ft), and West Virginia ($143.58 per sq.ft). Homes cost the most, on the other hand, in Hawaii ($677.83 per sq.ft), Washington, DC ($506.83 per sq.ft), and California ($502.67 per sq.ft).
Furthermore, the long-standing shortage of new construction, partly attributed to the stringent zoning laws in many states, including Montana and Oregon, leads to a discrepancy between supply and demand, further exacerbating the house affordability crisis. Another thing important to note is that coastal areas, as is the case with coastal cities in California, for instance, tend to be significantly more expensive than inland regions. This is due to their vulnerability to natural disasters such as hurricanes and flooding, resulting in higher taxes and insurance costs. Other factors are the presence of tourist areas, the limited land for construction, various environmental laws, and the concentration of high-income towns near the coast. Additionally, factors like access to amenities such as beaches and waterfronts, and longer transportation distances for goods, as seen in Hawaii, also drive prices up.
The States With the Highest Home Price-to-Income Ratio
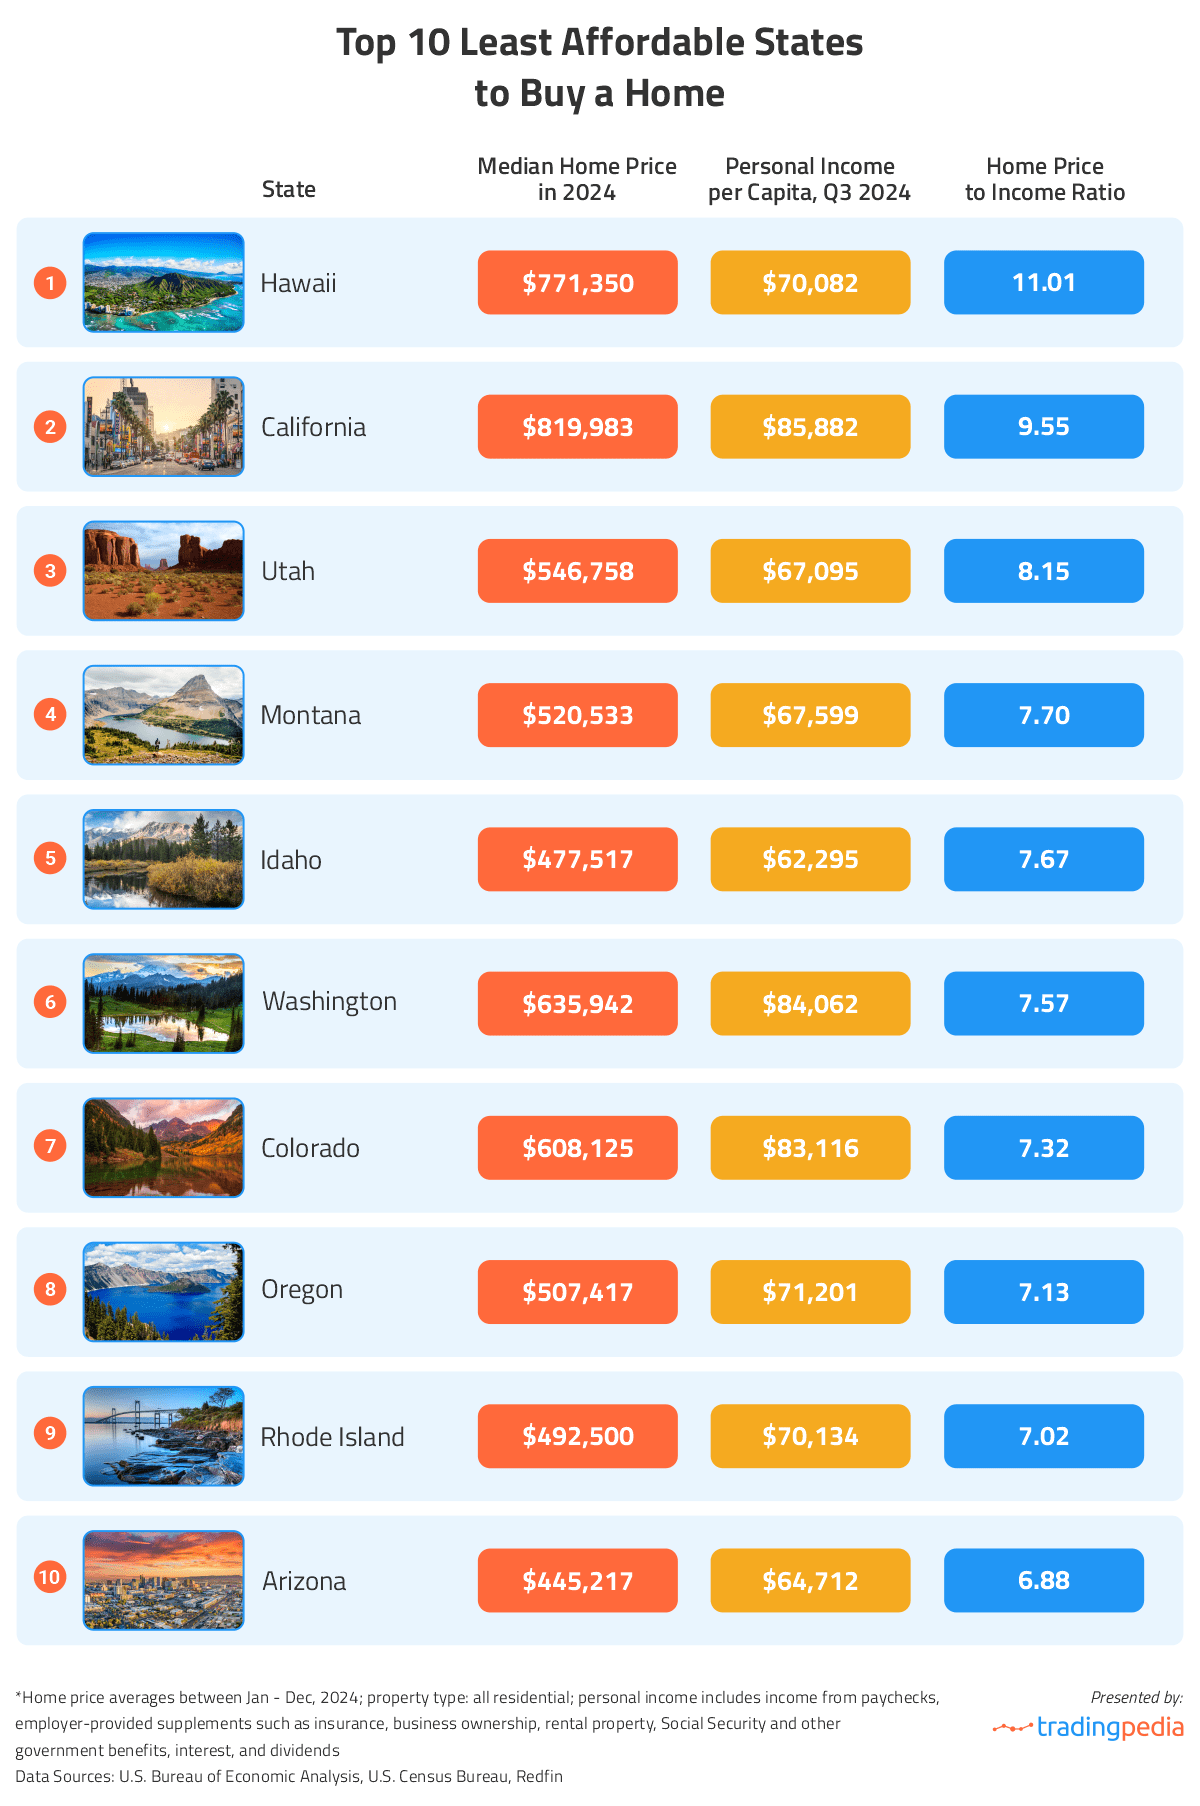
Residents of Hawaii enjoy living in one of the most breathtaking places on earth but at a high cost. Supposing their income is $70,082 per year, it would take them just over eleven years to save for a home ($771,350) if they set aside every single dollar earned during this time. It might cost them even more to live there since everything from food to transportation and housing costs is simply more expensive compared to the mainland.
California, on the other hand, has the highest median home prices in the country ($819,983), nearly double the national average of $428,201. The five most expensive metropolitan areas are also all in California with San Jose holding the top position. At the same time, California has the fifth highest personal income per capita ($85,882/year), which means that the homes there are the second least affordable in the U.S.; the ratio of median home price to income is 9.55.
Although there were a large number of home sales in the Golden State last year, 274,552 between January and the end of December, these were just 6.96 sales per 1,000 people. This is one of the lowest rates in the country; in comparison, Florida had 15.63 sales per 1,000 residents, Idaho had 13.62 per 1,000, South Carolina had 13.37, and North Carolina had 13.11.
Interestingly, Utah emerges as the third-most expensive state for buying a home, with the median home sales price at the end of November 2024 at $546,758. Coupled with а personal income of $67,095 a year, the prices of residential real estate here are unaffordable for many. Homes here are, on average, more than 8 times the annual income. Still, 37,479 homes were sold between January and December of 2024, which is roughly 10.7 sales per 1,000 residents.
The Most Affordable States for Homebuyers
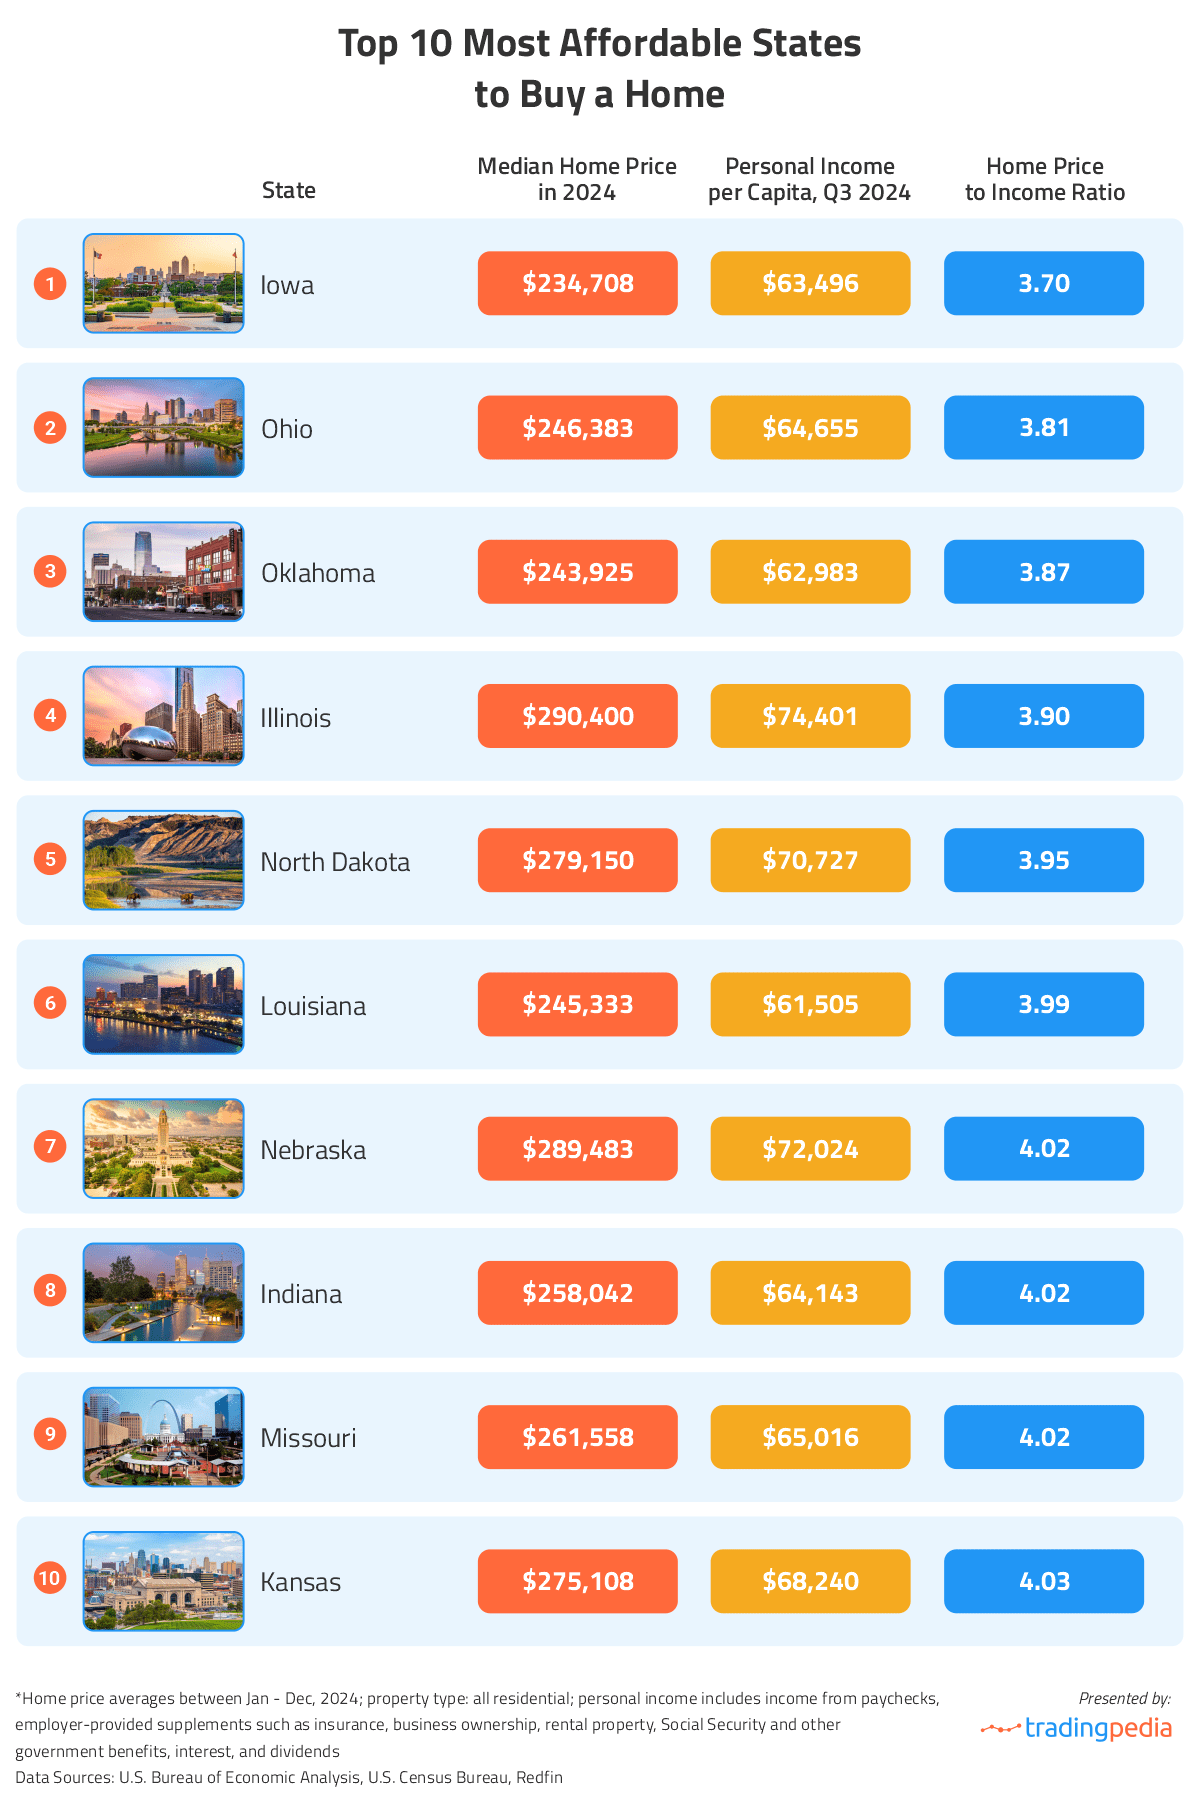
Based on median home prices and annual income, Iowa emerges as the most affordable housing market in the U.S. The median sales price for all residential properties increased slightly from 2023 to $234,708, the lowest rate in the country. Interestingly, Iowa does not have the lowest price per sq.ft of residential real estate. In 2024, it was $153.58, significantly more than Mississippi’s $139.17 per sq.ft or the rates in Louisiana and Indiana that hovered around $141.5. The personal income per capita in Iowa, however, is much higher compared to Mississippi; it is $63,496 a year versus only $52,428/year in the Magnolia State.
Among the top 10 “cheapest” U.S. housing markets, Illinois saw the most home sales last year (135,841). It also features the highest price per sq.ft among those 10 states ($179.50/sq.ft), as well as the highest income per capita ($74,401/year), which helps it stay among the most affordable places for buying a home in the country. Missouri, on the other hand, boasts the highest ratio of home sales per 1,000 residents (12.54) among these ten most affordable states.
Metro Areas with the Cheapest and the Most Expensive Homes in 2024
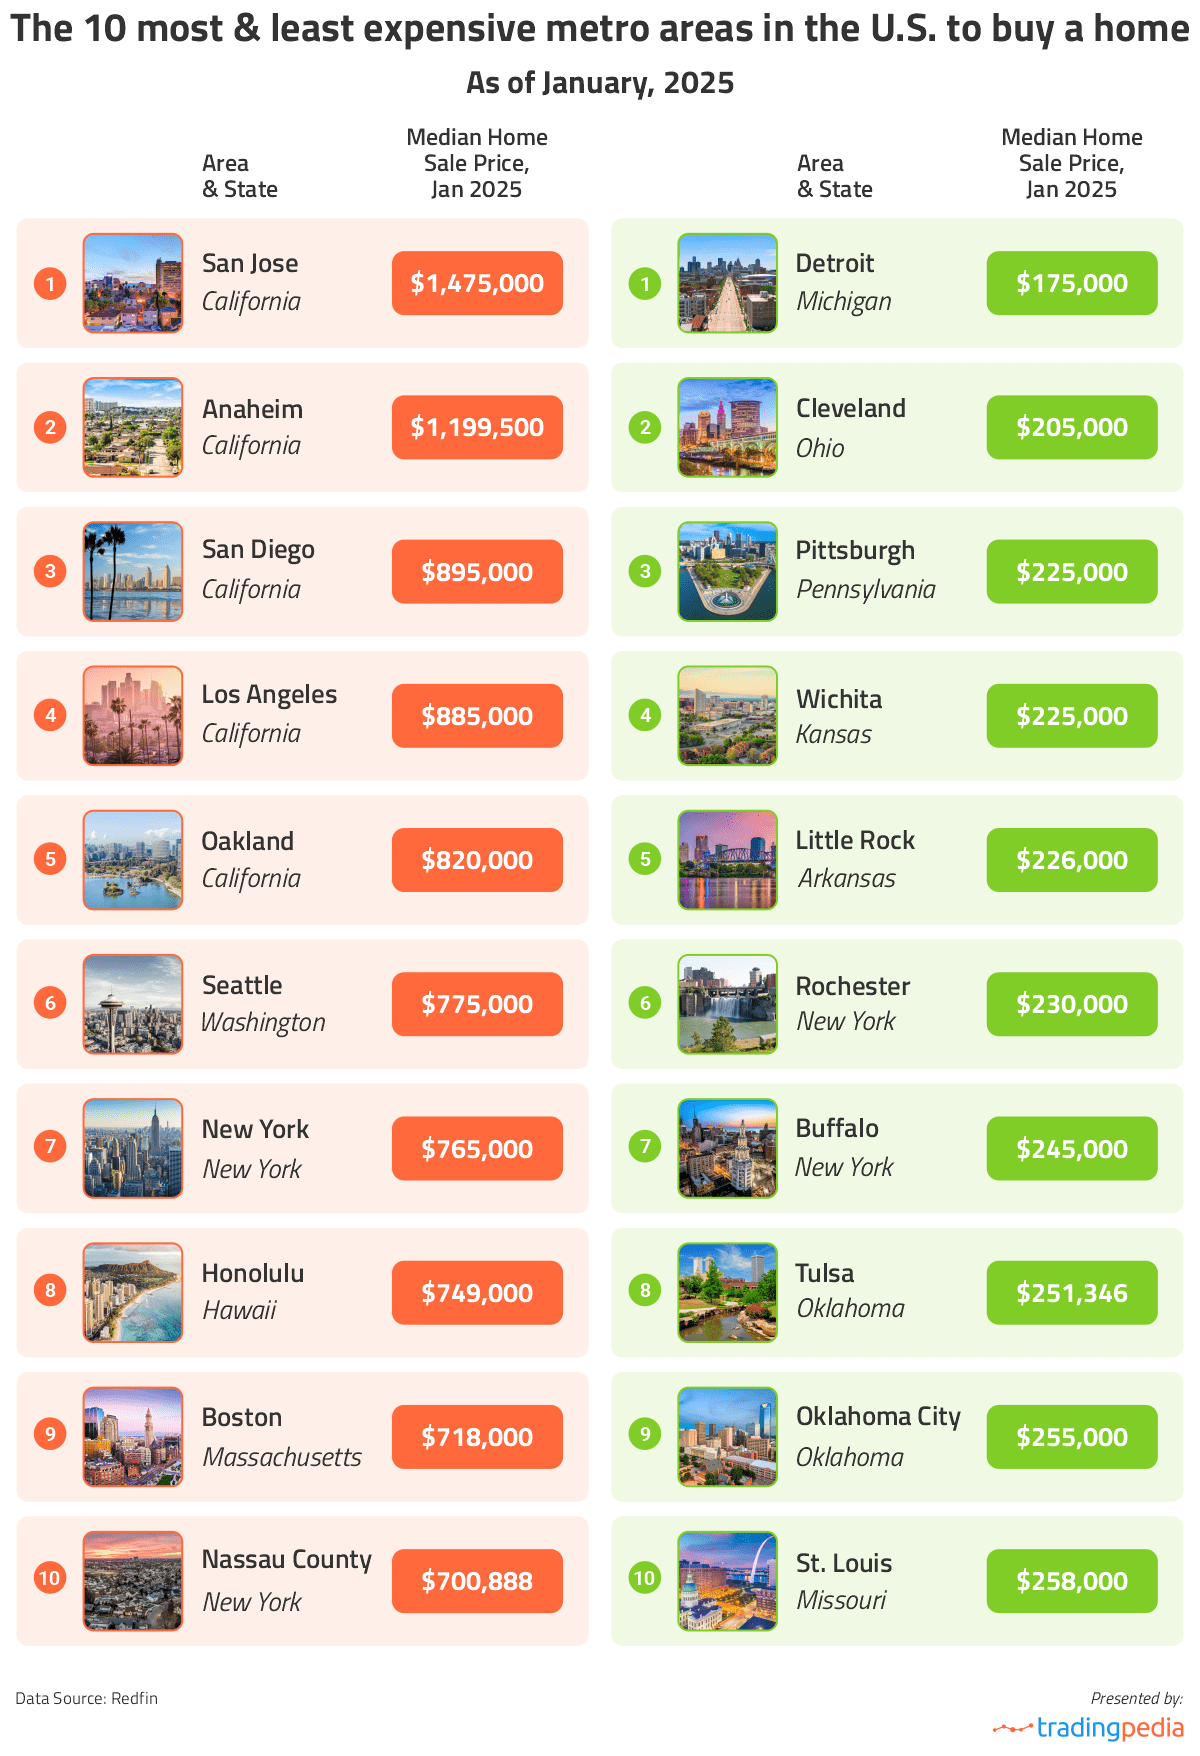
The team at TradingPedia also checked the latest home sales data for metropolitan areas from Redfin. We picked only metros where a minimum of 500 homes were sold in January 2025. Of the 65 metro areas with at least a thousand sales, the San Jose metropolitan area in California, typically associated with Silicon Valley, is the most expensive metro area in the U.S. for purchasing a home.
The metro area consists of the City of San Jose, which is located in the heart of the Santa Clara Valley, along with Sunnyvale and Santa Clara. Most of what is considered as Silicon Valley lies within this area and the high concentration of high-technology companies paired with the extremely high land prices has been driving property prices up over the past couple of decades. As of January 30, 2025, the median home price for all residential properties was $1,475,000, up 7.08% from January 2024.
On the flip side, Metro Detroit is the metropolitan area with the lowest home prices at the end of January 2025, with a median sales price of only $175,000. Greater Cleveland is the second cheapest metro area in the U.S. with a median rate of $205,000, followed by the Pittsburgh metropolitan area where the median home price is $225,000.
If we look at all metro areas (928 in total), not just those with a minimum of 500 sales in January, we can see the most expensive places are mostly exclusive, affluent areas with extremely high prices and limited inventory. The priciest area for purchasing a home is Vineyard Haven, one of the three main population centers on Martha’s Vineyard. The median sales price as of November 2024 in the community was $2,250,000, down 2.2% from the same month in 2024. With a year-round population of around 2,000 and just 12 sold homes in January, Vineyard Haven can hardly be described as a metropolitan area.
The other area with median home prices above those in the San Jose – Santa Clara area is Heber, a city 43 miles southeast of Salt Lake City. It is the county seat of Wasatch County and its population is just under 17,000, with more than a quarter of residents commuting to Park City and Salt Lake City for work. Popular among tourists, the area also experienced population growth in the 1990s and 2000s, which increased real estate prices. In January, 140 homes were sold in the Heber City metro area.
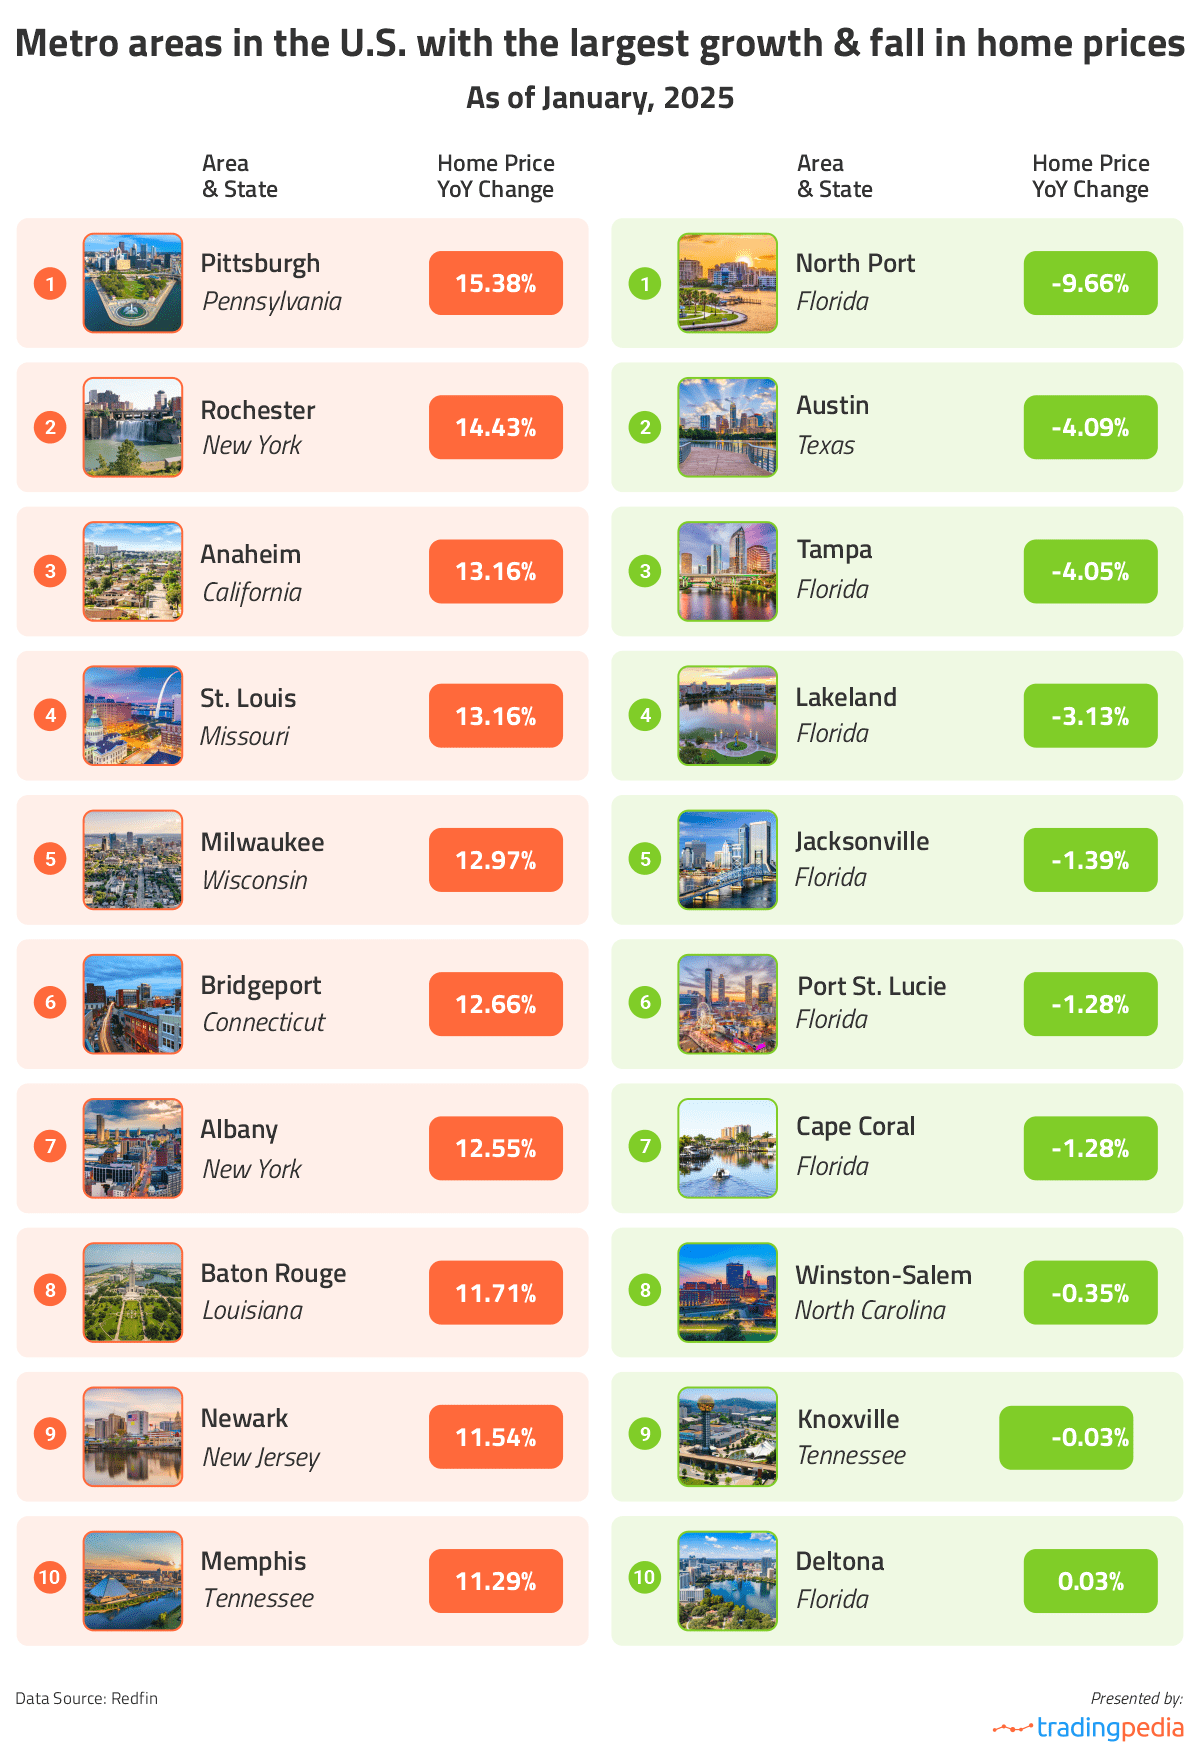
Out of those areas with a thousand sales or more, the metro area with the fastest growing home prices is Pittsburgh. Median prices for all residential properties rose by 15.38% year-over-year in January 2025 to $225,000. Another area with quickly growing real estate prices is Rochester, NY where the median price has increased by 14.43% to $230,000 compared to January 2024.
Conversely, the North Port metropolitan area in Florida witnessed the largest year-over-year price drop among the analyzed metros with 500 sales or more. The area, which also consists of the cities of Bradenton and Sarasota, saw its median home price decline by 9.66% between January 2024 and January 2025 when it was $423,000. Several other metro areas with drops in home sales prices are also located in Florida and include Tampa, Lakeland, Jacksonville, Cape Coral, Tampa, and Port St. Lucie. Prices also fell in Austin, TX; in January, the median price was $412,400, down 4.09% from the same month in 2024.
| Metropolitan Area | Median Sale Price (January 2025) | Change in Price YoY | Median Price per sq.foot | Homes Sold in January 2025 |
|---|---|---|---|---|
| San Jose, CA metro area | $1,475,000 | 7.08% | $899.93 | 604 |
| Anaheim, CA metro area | $1,199,500 | 13.16% | $666.54 | 1,295 |
| San Diego, CA metro area | $895,000 | 5.29% | $588.44 | 1,537 |
| Los Angeles, CA metro area | $885,000 | 5.17% | $582.13 | 3,037 |
| Oakland, CA metro area | $820,000 | 2.21% | $560.86 | 981 |
| Seattle, WA metro area | $775,000 | 3.75% | $461.75 | 1,792 |
| New York, NY metro area | $765,000 | 9.29% | $458.73 | 4,291 |
| Honolulu, HI metro area | $749,000 | 7.00% | $656.11 | 511 |
| Boston, MA metro area | $718,000 | 7.16% | $412.31 | 2,181 |
| Nassau County, NY metro area | $700,888 | 10.38% | $454.31 | 1,742 |
| Naples, FL metro area | $699,608 | 7.80% | $385.57 | 626 |
| Bridgeport, CT metro area | $605,000 | 12.66% | $308.54 | 599 |
| Riverside, CA metro area | $588,000 | 6.91% | $328.06 | 2,815 |
| Newark, NJ metro area | $580,000 | 11.54% | $322.83 | 1,262 |
| Denver, CO metro area | $570,000 | 0.88% | $270.94 | 2,357 |
| Tacoma, WA metro area | $567,735 | 6.62% | $301.71 | 626 |
| Sacramento, CA metro area | $562,000 | 2.18% | $331.78 | 1,303 |
| Miami, FL metro area | $560,000 | 4.33% | $390.69 | 1,439 |
| New Brunswick, NJ metro area | $550,000 | 10.00% | $337.21 | 1,855 |
| Portland, OR metro area | $545,000 | 5.83% | $296.50 | 1,691 |
| Washington, DC metro area | $526,279 | 2.21% | $290.57 | 3,070 |
| Frederick, MD metro area | $525,000 | 7.14% | $274.36 | 703 |
| Salt Lake City, UT metro area | $520,000 | 4.21% | $249.36 | 702 |
| West Palm Beach, FL metro area | $520,000 | 7.22% | $304.51 | 1,501 |
| Boise City, ID metro area | $485,000 | 5.44% | $265.11 | 817 |
| Providence, RI metro area | $480,000 | 6.67% | $283.15 | 981 |
| Montgomery County, PA metro area | $469,470 | 5.98% | $241.34 | 1,230 |
| Phoenix, AZ metro area | $468,505 | 5.24% | $264.76 | 4,330 |
| Fort Lauderdale, FL metro area | $460,000 | 10.84% | $305.84 | 1,574 |
| Nashville, TN metro area | $459,000 | 3.15% | $237.95 | 1,799 |
| Las Vegas, NV metro area | $440,000 | 6.02% | $256.56 | 2,090 |
| Raleigh, NC metro area | $436,500 | 4.86% | $210.61 | 1,286 |
| Worcester, MA metro area | $431,000 | 5.12% | $262.26 | 615 |
| Charleston, SC metro area | $430,000 | 0.39% | $229.42 | 935 |
| North Port, FL metro area | $423,000 | -9.66% | $249.49 | 1,505 |
| Austin, TX metro area | $412,400 | -4.09% | $214.54 | 1,771 |
| Dallas, TX metro area | $405,300 | 1.10% | $194.07 | 3,572 |
| Orlando, FL metro area | $400,000 | 2.56% | $223.58 | 2,329 |
| Charlotte, NC metro area | $395,000 | 3.95% | $210.95 | 2,266 |
| Port St. Lucie, FL metro area | $385,000 | -1.28% | $228.96 | 579 |
| Cape Coral, FL metro area | $385,000 | -1.28% | $229.17 | 1,113 |
| Richmond, VA metro area | $382,500 | 5.37% | $210.61 | 938 |
| Atlanta, GA metro area | $379,995 | 0.53% | $184.06 | 4,396 |
| Knoxville, TN metro area | $374,900 | -0.03% | $207.50 | 732 |
| Minneapolis, MN metro area | $374,000 | 5.07% | $190.35 | 2,497 |
| Tucson, AZ metro area | $369,000 | 1.10% | $222.26 | 864 |
| Baltimore, MD metro area | $360,000 | 2.86% | $208.33 | 2,010 |
| Palm Bay, FL metro area | $360,000 | 4.50% | $209.99 | 691 |
| Tampa, FL metro area | $355,000 | -4.05% | $217.38 | 3,468 |
| Jacksonville, FL metro area | $355,000 | -1.39% | $200.51 | 1,520 |
| Fayetteville, AR metro area | $352,950 | 3.81% | $205.00 | 652 |
| Deltona, FL metro area | $350,000 | 0.03% | $203.61 | 823 |
| Fort Worth, TX metro area | $350,000 | 1.45% | $185.03 | 1,594 |
| New Haven, CT metro area | $350,000 | 6.87% | $218.75 | 545 |
| Hartford, CT metro area | $350,000 | 7.69% | $212.26 | 817 |
| Myrtle Beach, SC metro area | $345,000 | 0.12% | $202.92 | 1,212 |
| Virginia Beach, VA metro area | $345,000 | 7.81% | $203.35 | 1,434 |
| Camden, NJ metro area | $339,900 | 7.90% | $217.81 | 931 |
| Elgin, IL metro area | $336,000 | 6.33% | $189.09 | 552 |
| Chicago, IL metro area | $335,500 | 7.19% | $210.63 | 4,293 |
| Lake County, IL metro area | $330,000 | 6.45% | $194.36 | 521 |
| Wilmington, DE metro area | $330,000 | 7.32% | $197.59 | 518 |
| Houston, TX metro area | $327,500 | 2.12% | $162.48 | 5,119 |
| Greenville, SC metro area | $325,000 | 2.52% | $171.22 | 735 |
| Huntsville, AL metro area | $321,495 | 0.48% | $160.22 | 533 |
| Allentown, PA metro area | $320,000 | 10.34% | $197.86 | 562 |
| Pensacola, FL metro area | $319,900 | 1.33% | $181.44 | 535 |
| Columbus, OH metro area | $318,000 | 3.33% | $184.49 | 1,363 |
| Grand Rapids, MI metro area | $315,000 | 1.78% | $209.29 | 679 |
| Kansas City, MO metro area | $315,000 | 8.12% | $168.90 | 1,643 |
| Lakeland, FL metro area | $310,000 | -3.13% | $180.25 | 817 |
| Albany, NY metro area | $305,000 | 12.55% | $191.78 | 627 |
| Omaha, NE metro area | $304,000 | 4.65% | $160.48 | 712 |
| Milwaukee, WI metro area | $300,500 | 12.97% | $189.60 | 914 |
| San Antonio, TX metro area | $295,000 | 1.72% | $161.27 | 1,946 |
| Indianapolis, IN metro area | $294,000 | 5.33% | $147.06 | 1,638 |
| Des Moines, IA metro area | $290,000 | 7.41% | $200.70 | 602 |
| Winston-Salem, NC metro area | $288,000 | -0.35% | $169.79 | 510 |
| Fayetteville, NC metro area | $287,500 | 6.48% | $155.39 | 500 |
| Warren, MI metro area | $287,000 | 6.30% | $189.95 | 1,814 |
| Greensboro, NC metro area | $285,000 | 4.78% | $170.41 | 559 |
| Augusta, GA metro area | $284,990 | 4.97% | $150.11 | 549 |
| New Orleans, LA metro area | $280,000 | 5.86% | $161.71 | 593 |
| Memphis, TN metro area | $279,750 | 11.29% | $150.00 | 762 |
| Cincinnati, OH metro area | $276,000 | 8.88% | $167.12 | 1,481 |
| Birmingham, AL metro area | $275,383 | 3.45% | $148.68 | 774 |
| Ocala, FL metro area | $275,000 | 1.89% | $171.48 | 618 |
| Gary, IN metro area | $270,500 | 10.41% | $152.17 | 542 |
| Philadelphia, PA metro area | $267,500 | 2.88% | $193.36 | 1,279 |
| Louisville, KY metro area | $266,000 | 6.41% | $154.72 | 938 |
| El Paso, TX metro area | $264,975 | 2.70% | $155.43 | 526 |
| Baton Rouge, LA metro area | $262,525 | 11.71% | $150.49 | 531 |
| St. Louis, MO metro area | $258,000 | 13.16% | $148.00 | 1,994 |
| Oklahoma City, OK metro area | $255,000 | 1.80% | $155.48 | 1,267 |
| Tulsa, OK metro area | $251,346 | 4.73% | $149.53 | 818 |
| Buffalo, NY metro area | $245,000 | 6.57% | $161.95 | 740 |
| Rochester, NY metro area | $230,000 | 14.43% | $155.10 | 613 |
| Little Rock, AR metro area | $226,000 | 0.44% | $140.32 | 612 |
| Wichita, KS metro area | $225,000 | 4.53% | $118.87 | 521 |
| Pittsburgh, PA metro area | $225,000 | 15.38% | $158.98 | 1,257 |
| Cleveland, OH metro area | $205,000 | 10.36% | $145.70 | 1,480 |
| Detroit, MI metro area | $175,000 | 2.94% | $142.79 | 1,132 |
Methodology
We also used data from the U.S. Bureau of Economic Analysis, providing personal income figures for the third quarter of 2024 for every state. To get the actual income per capita we divided the income of each state by its population population (as per the U.S. Census Bureau).
Lastly, we determined the home price-to-income ratio for each state by dividing its median home prices for the entire 2024 by the per capita income. As for the homes sold per 1,000 people figure, we divided the total number of properties sold in 2024 in every state by its population and then multiplied this number by 1,000.
Full data