Key moments
- DXY recovers to approximately 103.55, rebounding from a four-month low.
- Technical analysis indicates an oversold RSI, suggesting potential consolidation.
- Key support identified in the 103.00-103.10 range, with resistance at 104.40.
DXY Technicals: 103.55 Rebound, Support at 103.00, Resistance at 104.40
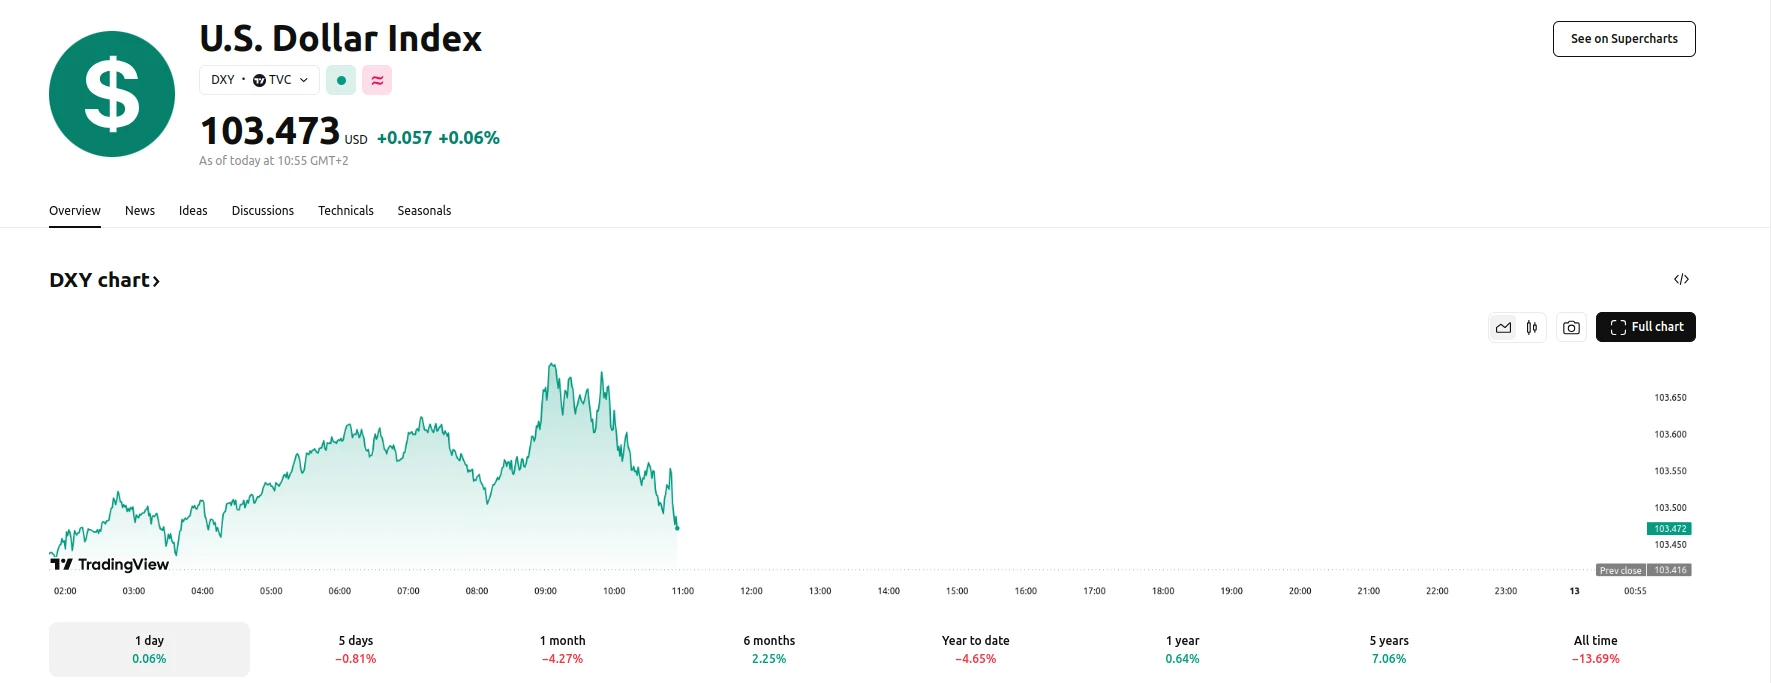
The US Dollar Index (DXY), which measures the dollar’s value against a basket of six major currencies, has experienced a recovery, climbing to near 103.55 in early European trading. This rebound follows a dip to around 103.20, a four-month low. However, despite this upward movement, concerns regarding a potential US economic slowdown and the broader impact of tariffs on global economic growth are tempering expectations for sustained gains.
Technical analysis of the DXY daily chart reveals a persistent bearish sentiment, with the index remaining below the 100-day Exponential Moving Average (EMA). The 14-day Relative Strength Index (RSI) reinforces this downward momentum, positioning itself below the midline. Nevertheless, the RSI’s oversold condition suggests the possibility of a period of consolidation before any further depreciation of the DXY. This indicates a potential for short term sideways price action.
The 103.00-103.10 zone has emerged as a crucial support level, coinciding with the lower boundary of the Bollinger Band and a significant psychological threshold. A breach of this support could lead to further declines, with subsequent support identified at 102.27 and 100.53. Conversely, resistance is noted at 104.40, and a break above this level could pave the way for a move towards 106.35 and potentially 107.38. The market is weighing the technical signals against the underlying economic concerns, creating a complex picture for the DXY’s near-term trajectory.