Forex Trading Strategy – combining two sets of Fibonacci retracements
You will learn about the following concepts
- Indicators used with this strategy
- Signals to be looking for
- Entry point
- Stop-loss
- Profit target
Generally traders will be using Fibonacci retracements or extensions in an attempt to detect confluences with other key levels, such as support/resistance, pivot points and etc. The idea of combining two sets of Fibonacci retracements is to detect at least two strong Fibonacci levels in an area of possible support or resistance. Traders know that such confluences will likely trigger reaction, which they can use when making decisions how to position themselves.
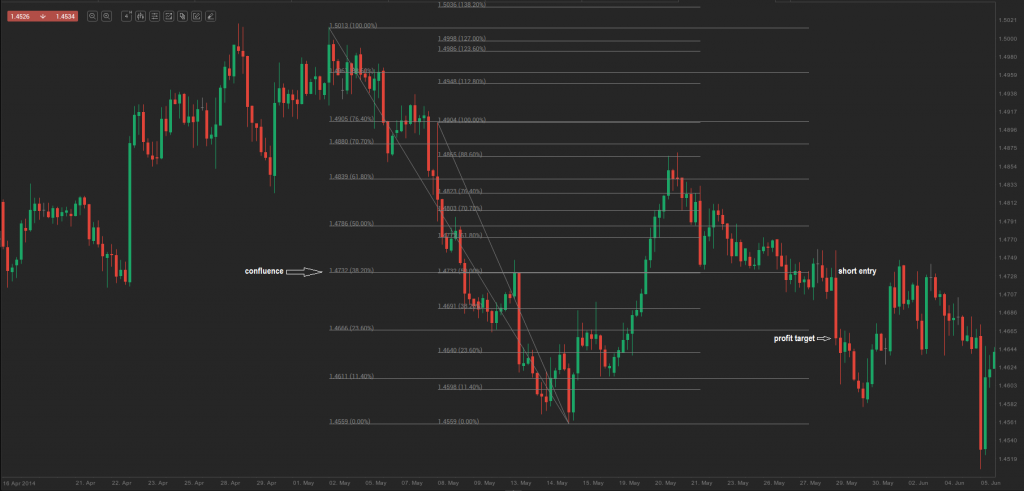
Let us look at the 4-hour chart of EUR/AUD below. There was a prominent bear trend and a few large retracements. We take the last prominent swing high and the swing low in the middle of the screen. These are the points we use in order to draw the first set of Fibonacci retracement levels. Next, we take a lower swing high and the same swing low and draw another set of Fibonacci retracements. As can be seen on the chart, there is indeed a confluence between the 38.2% retracement from the first Fibonacci set and the 50.0% retracement from the second set. This provides us with the opportunity to enter the market in the direction of the underlying trend (bear).
Such combination of two Fibonacci sets may produce even more reliable signals, when viewed in a context with other key price levels and patterns – support/resistance, pivot points, round numbers and of course candlestick formations.
In the example above, the protective stop may have been placed at the high price of the bull trend candle, which marked the end of the retracement, while the profit target may have been set to a round number – the 1.4650 level in this case.
