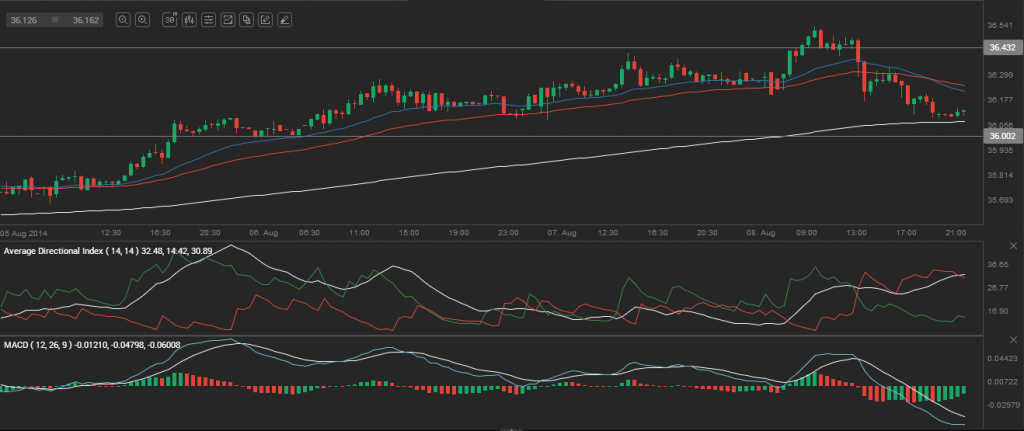
Friday’s trade saw USD/RUB within the range of 36.117-36.544. The pair closed at 36.161, losing 0.52% on a daily basis, which trimmed the weekly gain to 1.14%.
Fundamental view
Russian Federation
The surplus on Russias trade balance probably expanded to 18.700 billion USD in June, according to the median forecast by experts, following a surplus of 18.280 billion USD in the prior month. The trade balance, as an indicator, measures the difference in value between country’s exported and imported goods and services during the reported period. It reflects the net export of goods and services, or one of the components to form nation’s Gross Domestic Product. Generally, exports reflect economic growth, while imports indicate domestic demand.
The Russian Federation registers regular trade surpluses, because of its diversified exports. Nations main exports include oil and natural gas, which account for almost 58% of the total exports. Russia also exports nickel, palladium, iron, chemical products, automobiles, military equipment and timber. It imports food, ground transports, pharmaceuticals, textile and footwear. The country had a record-high trade surplus at the amount of 20.356 billion USD in January 2012.
In case the trade balance surplus increased more than anticipated, this would provide support to the ruble. The Central Bank of Russia is scheduled to release the official numbers at 12:00 GMT on Monday (August 11th).
Technical view
According to Binary Tribune’s daily analysis, the central pivot point for the pair is at 36.274. In case USD/RUB manages to breach the first resistance level at 36.432, it will probably continue up to test 36.701. In case the second key resistance is broken, the pair will probably attempt to advance to 36.858.
If USD/RUB manages to breach the first key support at 36.002, it will probably continue to slide and test 35.847. With this second key support broken, the movement to the downside will probably continue to 35.577.
The mid-Pivot levels for Monday are as follows: M1 – 35.712, M2 – 35.926, M3 – 36.139, M4 – 36.353, M5 – 36.566, M6 – 36.780.
In weekly terms, the central pivot point is at 36.108. The three key resistance levels are as follows: R1 – 36.597, R2 – 37.032, R3 – 37.521. The three key support levels are: S1 – 35.673, S2 – 35.184, S3 – 34.749.


