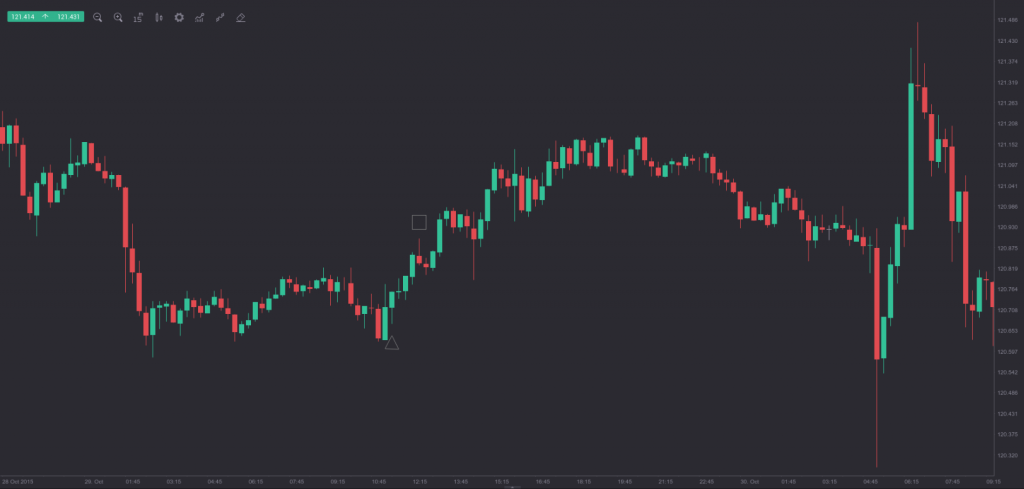
With this strategy we will take advantage of a pure price action technique. It is known as the Engulfing formation and consists of two consecutive bars/candles. What the pattern signals is a reversal of the prior trend. There are two variations of the pattern to be discerned – a bullish and a bearish engulfing formation.
In a trend, a bearish engulfing pattern would signal that the market has reached a top and a bear trend may be in its genesis, while a bullish engulfing suggests that the market has reached a bottom and a bull trend may be forming soon.
There are several criteria that need to be in force for an engulfing pattern to be discerned:
1. The market needs to be in a confirmed trend, no matter a long or a short-term one. Sideways price movement does not work for the engulfing formation.
2. The two candles must be of the opposite type, or one needs to be bullish and the other – bearish. If the first candle is bearish, then the second one must be bullish, so that a bullish engulfing pattern can be completed. Once recognized, it provides us with an opportunity to buy a call option. If the first candle is bullish, then the second one must be bearish, so that a bearish engulfing formation can be completed. Once recognized, it provides us with an opportunity to buy a put option.
3. The body of the first candle/bar must be smaller than that of the second one. It is not necessary for the second candle/bar to additionally engulf the wick of the first one, but still its high-low range must be at least equal or exceed the first candle’s high-low range.
4. The perfect engulfing pattern assumes that the body of the second candle engulfs the entire first candle with the inclusion of its shadows.
The time frame is set to 15 minutes, while the expiry time is 60 minutes (a four-candle expiration time). The USD/JPY chart below shows a bullish engulfing formation, with the small triangle marking the call entry and the small rectangle marking the expiry.
We should note that 60-second binary options can also be traded by using this strategy, but since the 1-minute chart can visualize larger price fluctuations, at times, the trading signals can be misleading.
