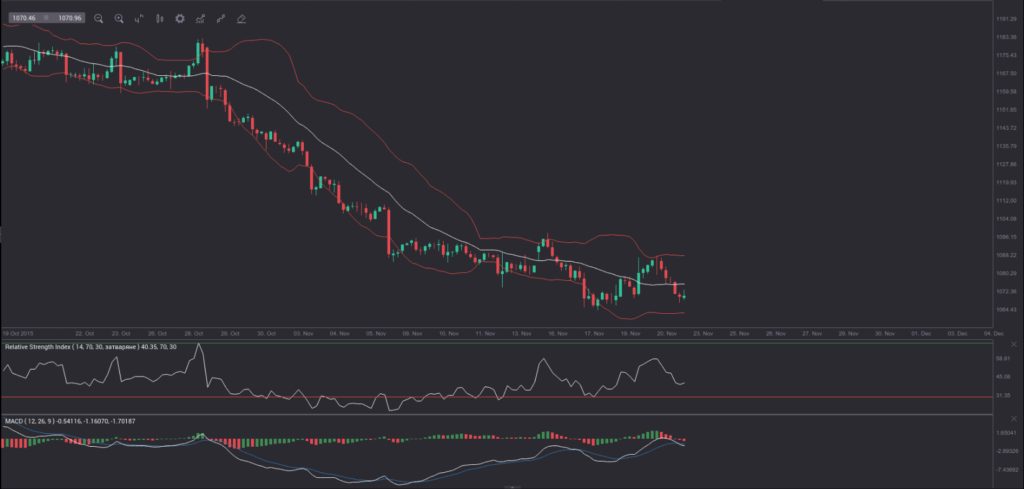
On Friday gold for delivery in December traded within the range of $1,075.00-$1,087.00. Futures closed at $1,076.40, losing 0.15% on a daily basis, following two consecutive trading days of gains. The daily low has been the lowest level since November 18th, when the yellow metal went down as low as $1,064.00. The latter has been the lowest price level since February 10th 2010. In weekly terms, the precious metal lost 0.41% of its value last week, while marking its fifth consecutive week of decline.
On the Comex division of the New York Mercantile Exchange, gold futures for delivery in December were losing 0.63% on Monday to trade at $1,069.50 per troy ounce. The precious metal went down as low as $1,067.10 earlier today, overcoming the lower range breakout level (S4). The metal has fallen below the middle Bollinger band (viewed on the 4-hour time frame) and is probably in for a test of the lower boundary and the low from November 18th. The 14-period Relative Strength Index (RSI) has fallen below its 50.00 level and is at a convenient distance from the oversold area, while the Moving Average Convergence Divergence (MACD) has indicated bearish momentum beginning to build up.
Gold has been under selling pressure recently as market participants assess the possibility of a rate hike by the Federal Reserve Bank at the policy meeting on December 15th-16th. An array of macroeconomic reports is to be released out of the United States later this week, which may bolster rate hike expectations.
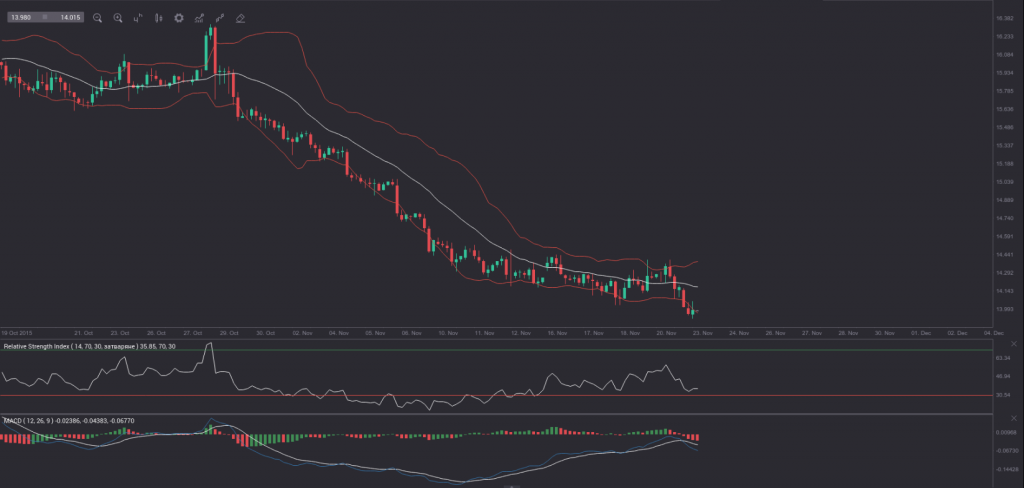
Meanwhile, silver futures for December delivery were losing 1.14% on the day to trade at $13.935 per troy ounce. The commodity slipped as low as $13.870 earlier on Monday, which has been the lowest level in more than six years. Viewed on the 4-hour time frame, silver has been trading in proximity to oversold area of the 14-period RSI in the past several hours, while bearish momentum has gradually increased.
Daily and Weekly Pivot Levels
By employing the Camarilla calculation method, the daily pivot levels for gold are presented as follows:
R1 – $1,077.50
R2 – $1,078.60
R3 (range resistance) – $1,079.70
R4 (range breakout) – $1,083.00
S1 – $1,075.30
S2 – $1,074.20
S3 (range support) – $1,073.10
S4 (range breakout) – $1,069.80
By using the traditional method of calculation, the weekly pivot levels for gold are presented as follows:
Central Pivot Point – $1,077.60
R1 – $1,091.20
R2 – $1,106.00
R3 – $1,119.60
S1 – $1,062.80
S2 – $1,049.20
S3 – $1,034.40


