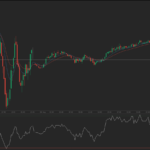
Friday’s trade saw GBP/USD within the range of 1.4577-1.4670. The pair closed at 1.4603, inching down 0.05% on a daily basis. It has been the 12th drop in the past 24 trading days. The daily high has been an exact test of the high from February 4th. In weekly terms, GBP/USD added 1.39% to its value during the current week. It has been the 10th gain in the past 17 weeks and also a third consecutive one. The major pair has extended its advance to 1.68% during the current month, following a 3.20% surge in March.
On Monday (May 2nd) GBP/USD trading may be influenced by the following macroeconomic reports as listed below.
Fundamentals
United Kingdom
Early May Bank Holiday
Monday (May 2nd) is the Early May Bank Holiday in the United Kingdom. Banks in the country are to remain closed. Various events are usually held in order to commemorate the end of the winter period and ”the fertility and hope” of the upcoming summer.
United States
Manufacturing PMI by Markit – final estimate
The final estimate of the Manufacturing Purchasing Managers Index for April probably confirmed the preliminary reading of 50.8, according to the median forecast by analysts. It has been the lowest PMI reading since September 2009. In March the final seasonally adjusted PMI stood at 51.5, inching up from a preliminary value of 51.4.
According to the preliminary report by Markit, ”Manufacturers cited generally subdued demand conditions, delays to spending decisions among clients and ongoing weakness within the energy sector.”
”April data pointed to a renewed slowdown in new business growth, with the latest expansion the least marked so far in 2016. Some survey respondents suggested that uncertainty in relation to the economic outlook and political climate had weighed on client spending in April. Moreover, export sales continued to act as a drag on overall new business volumes. Although only modest, the latest survey pointed to the sharpest drop in new work from abroad since November 2014.”
”Manufacturers indicated that tighter inventory management strategies persisted in April, led by the sharpest drop in stocks of purchases since the start of 2014. At the same time, post- production inventories decreased at a moderate pace and manufacturers recorded a renewed fall in purchasing activity. Despite softer demand for inputs, latest data signalled the sharpest deterioration in vendor performance since September 2015, which some survey respondents linked to insufficient stocks and capacity cuts among suppliers.”, Markit stated.
Values above the key level of 50.0 indicate predominant optimism (expanding activity). In case the final PMI for April came above market expectations, this would lead to a moderate bullish impact on the US dollar. The final reading is due out at 13:45 GMT.
Manufacturing PMI by the ISM
Activity in United States’ manufacturing sector probably increased at a slower pace in April, with the corresponding manufacturing PMI coming in at a reading of 51.5, according to market expectations, down from 51.8 in March. If so, this would be the second consecutive month of expansion, which followed four successive months of contraction.
The New Orders Index came in at 58.3 in March, improving from 51.5 in February. The sub-gauge of production was reported at 55.3 in March, advancing from 52.8 in February. The index of employment slipped to a value of 48.1 in March from 48.5 in the preceding month. The gauge of prices was at 51.5 in March, surging from 38.5 in February, which suggested prices of raw materials rose for the first time since October 2014. In January, 12 manufacturing industries reported growth, 5 reported contraction in overall business activity and 1 reported no change in conditions, according to the report by the Institute for Supply Management (ISM).
Readings above the key level of 50.0 are indicative of expanding activity in the sector of manufacturing. In case, however, the PMI slowed down more than anticipated, this would have a strong bearish effect on the US dollar. The Institute for Supply Management (ISM) is to release the official reading at 14:00 GMT.
Correlation with other Majors
Taking into account the business week ended on April 29th and the daily closing levels of the major currency pairs, we come to the following conclusions in regard to the strength of relationship:
GBP/USD to NZD/USD (0.8273, or very strong)
GBP/USD to EUR/USD (0.7103, or strong)
GBP/USD to AUD/USD (-0.3479, or moderate)
GBP/USD to USD/JPY (-0.6839, or strong)
GBP/USD to USD/CHF (-0.7060, or strong)
GBP/USD to USD/CAD (-0.9545, or very strong)
1. During the examined period GBP/USD moved strongly in one and the same direction with EUR/USD, while moving strongly in the opposite direction compared to USD/JPY and USD/CHF.
2. GBP/USD moved almost equally in one and the same direction with NZD/USD during the week, while moving almost equally in the opposite direction compared to USD/CAD.
3. The correlation between GBP/USD and AUD/USD was moderate.
Daily and Weekly Pivot Levels
By employing the traditional calculation method, the Monday pivot levels for GBP/USD are presented as follows:
Central Pivot Point – 1.4617
R1 – 1.4656
R2 – 1.4710
R3 – 1.4749
S1 – 1.4563
S2 – 1.4524
S3 – 1.4470
By using the traditional method of calculation again, the weekly pivot levels for GBP/USD are presented as follows:
Central Pivot Point – 1.4559
R1 – 1.4714
R2 – 1.4825
R3 – 1.4980
S1 – 1.4448
S2 – 1.4293
S3 – 1.4182


