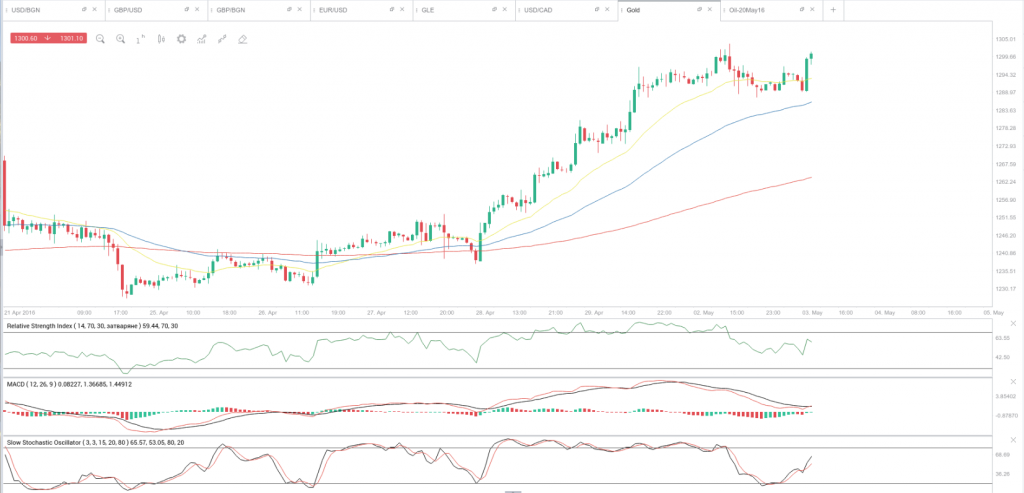
On Monday gold for delivery in June traded within the range of $1,289.50-$1,305.95. Futures closed at $1,291.70, edging up 0.20% from Fridays close. It has been the 34th gain in the past 63 trading days and also a sixth consecutive one. The daily high has been the highest price level since August 15th 2014, when a high of $1,312.80 was registered. The precious metal has risen 1.13% so far during the current month, following four consecutive months of advance. In April it added 4.46% to its value.
On the Comex division of the New York Mercantile Exchange, gold futures for delivery in June were gaining 0.89% on Tuesday to trade at $1,303.15 per troy ounce. The precious metal went up as high as $1,303.85 during the early phase of the European trading session, while the current daily low was at $1,291.00 per troy ounce, recorded during late Asian trade.
Today the precious metal may be influenced by the remarks of several Fed officials. At 14:30 GMT the Federal Reserve President for Cleveland and FOMC member, Loretta Mester, is scheduled to take a statement, followed by a speech by the Federal Reserve President for Atlanta, Dennis Lockhart, at 23:00 GMT.
Yesterday the ISM reported that manufacturing activity in the United States increased for a second straight month in April, but at a slower rate compared to a month ago. The respective Manufacturing Purchasing Managers Index came in at 50.8 last month, falling short of market consensus and also down from a reading of 51.8 in March. The sub-indexes for production, inventories and new orders registered a slower growth, while the gauge of employment remained below 50.00 in April. 11 manufacturing industries reported growth, 4 reported contraction and 3 reported no change in business conditions last month.
In technical terms, the hourly time frame for gold shows that the perfect order of the 21-period, the 55-period and the 200-period Exponential Moving Averages still holds, while bullish momentum is still present. At the same time, the 14-period Relative Strength Index is above its key 50.00 level, but at a distance from levels pointing to overbought conditions. This suggests that the bullish move may continue to extend for at least a test of the May 2nd high ($1,305.95). A break and close above it may send the commodity up for a test of August 15th 2014 high ($1,312.80). Support, on the other hand, may be received at the hourly 21-period EMA ($1,294.21) and then – at the hourly 55-period EMA ($1,286.73).
Meanwhile, silver futures for delivery in May were gaining 0.40% on the day to trade at $17.630 per troy ounce, after going up as high as $17.730 a troy ounce during the early phase of the European trading session.
Daily and Weekly Pivot Levels
By employing the traditional calculation method, the daily pivot levels for gold are presented as follows:
Central Pivot Point – $1,295.72
R1 – $1,301.93
R2 – $1,312.17
R3 – $1,318.38
S1 – $1,285.48
S2 – $1,279.27
S3 – $1,269.03
By using the traditional method of calculation again, the weekly pivot levels for gold are presented as follows:
Central Pivot Point – $1,272.10
R1 – $1,312.60
R2 – $1,336.00
R3 – $1,376.50
S1 – $1,248.70
S2 – $1,208.20
S3 – $1,184.80


