An agreement has been inked between Ford Motor Company (F) and Indias Mahindra & Mahindra Ltd over development of mid-size and compact sports utility vehicles, a Thursday joint statement by the two entities revealed. The Ford-Mahindra cooperation is expected to continue for up to three years, the companies said.
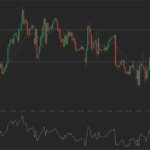
Ford shares closed lower for the third time in the past seven trading sessions on Thursday. It has also been the steepest daily loss since February 5th. The stock went down 3.15% ($0.35) to $10.75, after touching an intraday low at $10.73, or a price level not seen since March 13th ($10.73).
In the week ended on March 18th the shares of the global automotive company added 3.91% to their market value compared to a week ago, which marked a second consecutive period of gains. It has also been the best performance since the week ended on January 7th.
However, due to yesterdays slump, the stock has trimmed its advance to 1.32% so far during the current month, following a 3.28% drop in February. The latter has been a third straight month of losses.
For the entire past year, the shares of the NYSE-listed auto maker rose 2.97% following a 13.91% slump in 2016.
The partnerships focus is to be set on development of a mid-size sports utility vehicle that is expected to be “sold independently by both companies as separate brands”.
In addition, co-development of a compact sports utility vehicle as well as an electric car will also be evaluated, the companies said.
The cooperation with the Mumbai-based auto maker is likely to allow Ford to access lower cost electric vehicle designs as well as Indian suppliers in order to respond to competition in Asian markets.
According to CNN Money, the 22 analysts, offering 12-month forecasts regarding Ford Motor Company’s stock price, have a median target of $13.00, with a high estimate of $15.00 and a low estimate of $8.00. The median estimate is a 20.93% surge compared to the closing price of $10.75 on March 22nd.
The same media also reported that 17 out of 24 surveyed investment analysts had rated Ford Motor Company’s stock as “Hold”, while 4 – as “Buy”. On the other hand, 2 analysts had recommended selling the stock.
Daily and Weekly Pivot Levels
With the help of the Camarilla calculation method, today’s levels of importance for the Ford stock are presented as follows:
R1 – $10.78
R2 – $10.81
R3 (Range Resistance – Sell) – $10.84
R4 (Long Breakout) – $10.93
R5 (Breakout Target 1) – $11.03
R6 (Breakout Target 2) – $11.07
S1 – $10.72
S2 – $10.69
S3 (Range Support – Buy) – $10.66
S4 (Short Breakout) – $10.57
S5 (Breakout Target 1) – $10.47
S6 (Breakout Target 2) – $10.43
By using the traditional method of calculation, the weekly levels of importance for Ford Motor Company (F) are presented as follows:
Central Pivot Point – $11.09
R1 – $11.50
R2 – $11.85
R3 – $12.26
R4 – $12.67
S1 – $10.74
S2 – $10.33
S3 – $9.98
S4 – $9.63


