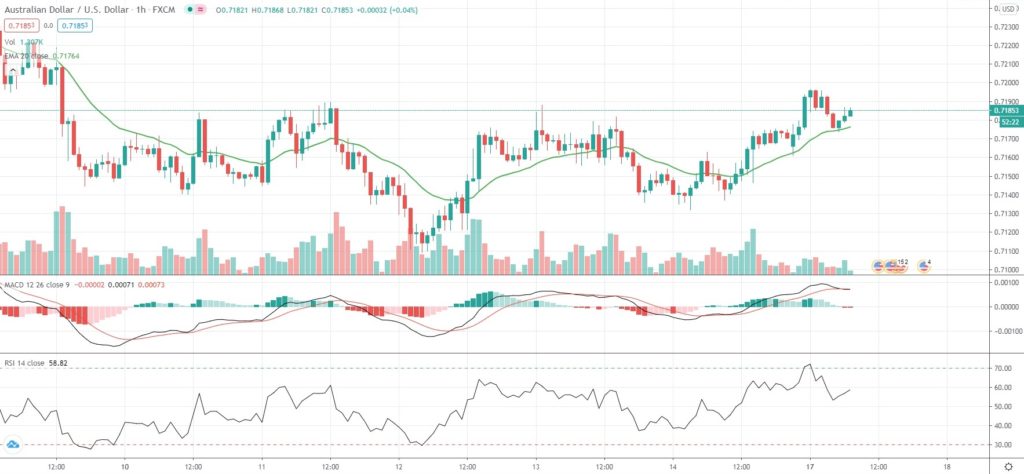
AUD/USD extended gains from the prior trading day and hit a fresh one-week high during early Asian session on Monday on investor relief following a delay in the review of the “Phase One” trade deal between the United States and China, which left the agreement intact.
“That’s good news in the sense that it’s something we can place on the back burner for now,” Rodrigo Catril, senior foreign exchange strategist at National Australia Bank, said.
Market players are also expecting the Minutes from the Reserve Bank of Australia and the Federal Reserve latest policy meetings, due out on Tuesday and Wednesday respectively, for more clues over policy outlook. Speculation has emerged that an average inflation target may be adopted by the Federal Reserve in an attempt to drive inflation above 2% for some time and to compensate for the period it has remained below that level.
“The bond market is key here,” Chris Weston, head of research at Australian brokerage Pepperstone, said.
“If the Fed can drive down real yields then the dollar will follow, and gold will rally – and vice versa.”
As of 7:02 GMT on Monday AUD/USD was edging up 0.21% to trade at 0.7185, after earlier touching an intraday high at 0.7196, or a level not seen since August 7th (0.7243). The major pair advanced 3.48% in July, which marked its fourth consecutive month of gains. The pair has risen another 0.65% so far this month.
On today’s economic calendar, the Federal Reserve Bank of New York will report on manufacturing activity in the area at 12:30 GMT. The New York Empire State Manufacturing Index probably dropped to 15.0 in August, according to market expectations, from a level of 17.2 in the prior month. July’s reading pointed to the first increase in business activity in New York since the start of the COVID-19 pandemic and also the sharpest increase since November 2018.
Bond Yield Spread
The spread between 2-year Australian and 2-year US bond yields, which reflects the flow of funds in a short term, equaled 13.9 basis points (0.139%) as of 6:15 GMT on Monday, up from 13.6 basis points on August 14th.
Daily Pivot Levels (traditional method of calculation)
Central Pivot – 0.7159
R1 – 0.7186
R2 – 0.7203
R3 – 0.7230
R4 – 0.7257
S1 – 0.7143
S2 – 0.7116
S3 – 0.7100
S4 – 0.7084


