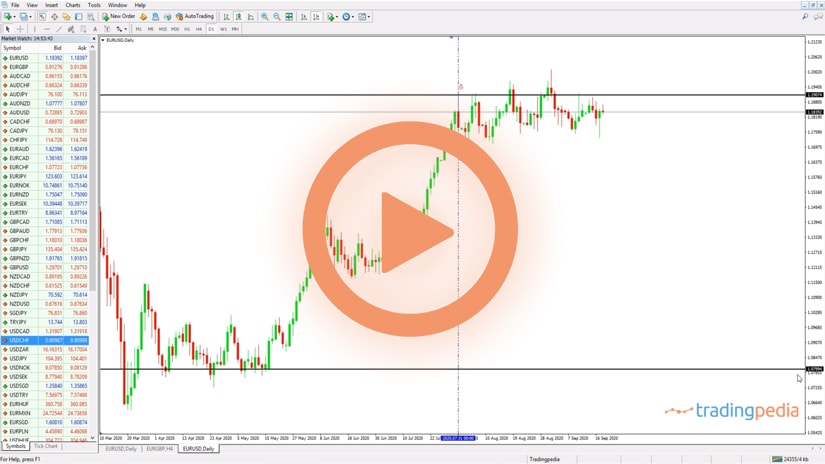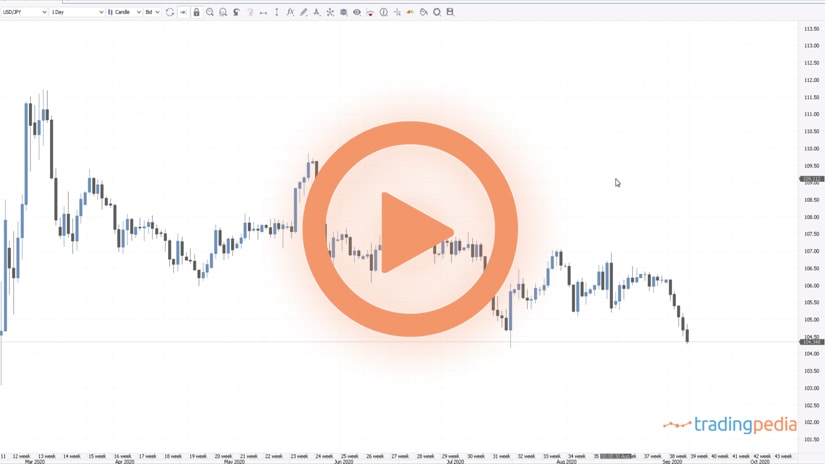
Hello there, this is tradingpedia.com and this video deals with the Chinkou – the most important element when using the Ichimoku indicator. I explained in the previous video that the Kinjun/Tenkan cross is one way to trade with the indicator. Also, another way is to look for the cloud to provide support and resistance to future price levels.
Things To Consider
But the best way to use the indicator is to focus on the Chinkou – the most important line of them all. Chinkou will always have the tendency to avoid the obstacles in front of it. For instance, if this is Chinkou here, you should think that the price is 26 periods ahead. For this candlestick, this is the Chinkou.
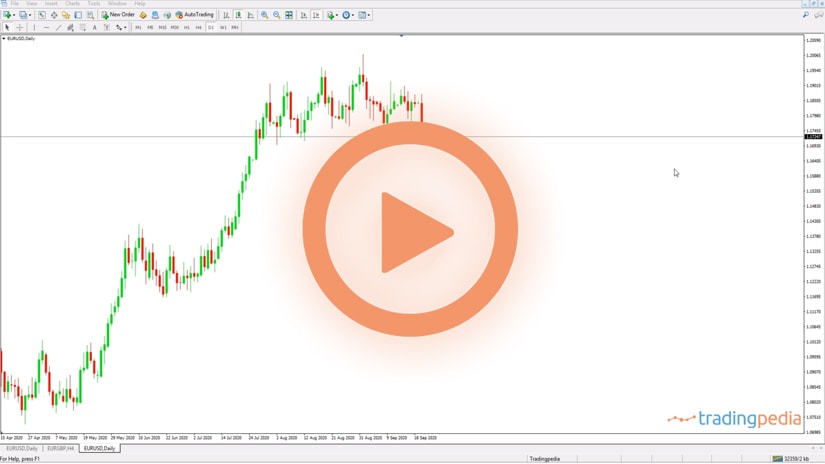
Another thing to consider is that it does not show the upper and lower shadows of the candlesticks. While the real price action shows a new higher high at 1.20, in reality, Chinkou declined from the closing price here to here.
Everything that sits below the Chinkou in a bullish trend represents support. The Chinkou will have the tendency to avoid the candlesticks in front of it.
By the time that the Chinkou gets closer to the candlesticks, a move higher is expected because of that. On this particular setup on the EURUSD it came quite close to the candlesticks but in a strong trend it will try to keep a distance from the main candlesticks.
On a strong, bullish trend, everything below is support. Therefore, the idea is not to look for support or resistance when the price hits the cloud or the kumo, but when Chinkou does that. So far Chinkou managed to pass three layers of support. The next ones are the upper and lower edges of the cloud.
Every support broken represents resistance, so if the price turns Chinkou meets resistance difficult to break because of a confluence area and the price will likely be rejected. Remember that this is equilibrium at a glance, meaning that what the price did in the past is as important as what the price does in the present.
An Example
Let’s have a different pair, let’s take the EURCAD on the 1h chart. We see that in March 2020, on this candlestick for instance, you must consider 26 periods on the right and left side of the candlestick. We did not know the cloud here, but only 26 candlesticks.
Chinkou here tried to avoid the candlesticks and the support, the price made a new high, the price reversed and Chinkou closed below support. The next layer of support was the Tenkan line. Support gave way, then Chinkou met the cloud. At that point, the price was here. So why did the price reverse, as it was no support here? The Chinkou was at support, that’s why.
The market then reversed and climbed, but Chinkou met resistance and eventually was rejected. When it fell below the cloud, that is a decisive break as there is no support for Chinkou anymore.
Everything above now is resistance. The market bounced, Chinkou met resistance and rejected. In a strong trend, Chinkou will try to avoid the obstacles in front of it and it did so all the way through here. The more the Chinkou has the ability to come closer to the elements it is supposed to avoid, the more the trend weakens. Here, at one point, the more it tried, and eventually it managed to reverse.
Related Videos
Conclusion
Therefore, when you try to interpret the current market price (let’s go back to the EURUSD) you should focus on all the elements offered by the indicator. For instance, instead trading a bearish cross here, it is best to trade a bullish cross because the cloud is bullish and the Chinkou is right at the moment where it is supposed to avoid the candlesticks in front of it. It comes as a reinforcement of the bullish trade especially if coupled with the bullish cloud too.
Thank you for being here, bye, bye.
