For this strategy we will utilize two Stochastic Oscillators with different settings – one with a shorter period and one with a longer period. We do so, in order to avoid false signals generated by the shorter-term Stochastic and also to avoid delays generated by the longer-term Stochastic. For a detailed overview of the Stochastic Oscillator, you can check this article out.
The shorter-term oscillator will have settings such as 9, 3, 3, oversold at 20.0 and overbought at 80.0, while the longer-term oscillator will have settings such as 21, 9, 9, oversold at 20.0 and overbought at 80.0.
What a trader needs to look for is almost coincident crossings of the signal lines for both Stochastic Oscillators, while these crossings need to be either at/in the oversold zone, or at/in the overbought zone.
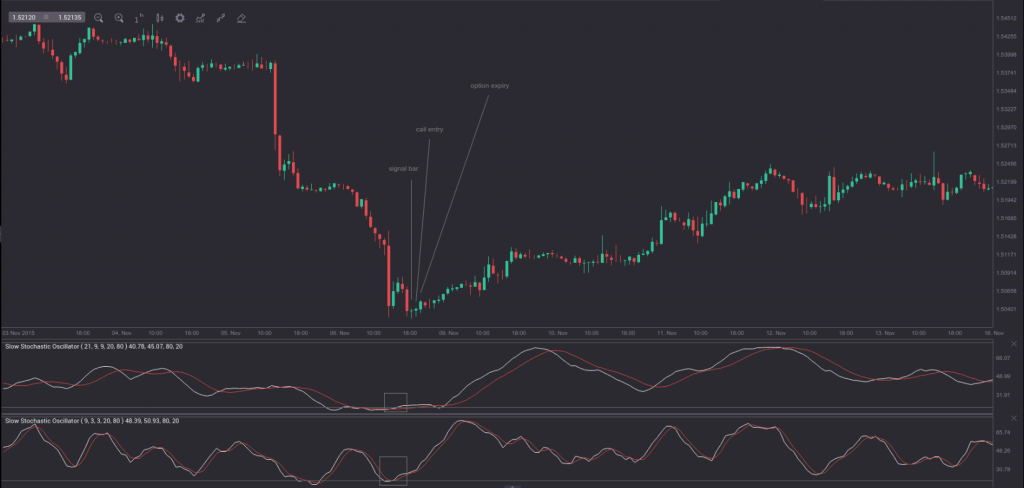
In order to buy a call option, a trader needs to have confirmation that a bullish reversal will occur. He/she needs to ensure that both oscillators have touched or have fallen below their oversold levels (20.0) and also that at each oscillator the two lines cross one another. After the close of the current bar, a trader needs to look for a suitable spot to make his/her call entry. The 1-hour chart below visualizes the spot where lines cross at each of the two oscillators, where a call entry should be made and the option expiry.
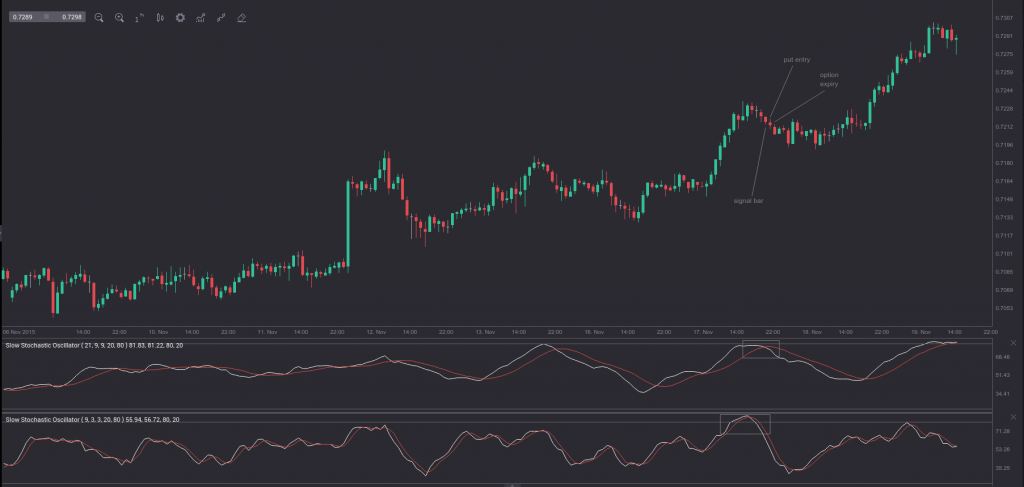
In order to buy a put option, a trader needs to have confirmation that a bearish reversal will occur. He/she needs to ensure that both oscillators have touched or have climbed above their overbought levels (80.0) and also that at each oscillator the two lines cross one another. After the close of the current bar, a trader needs to look for a suitable spot to make his/her put entry. The 1-hour chart below visualizes the spot where lines cross at each of the two oscillators, where a put entry should be made and the option expiry.

