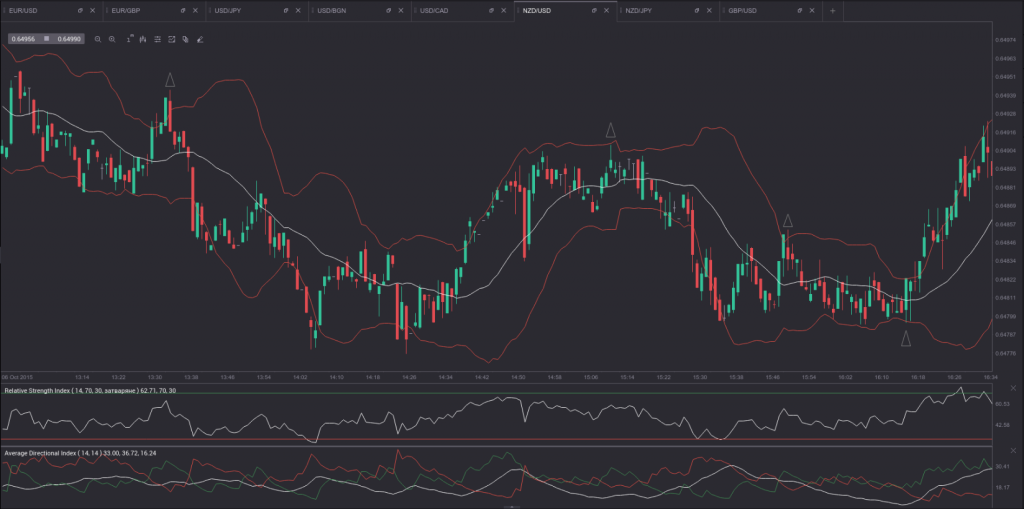
This strategy may suit the preferences of impatient binary option traders, as it may be applied on any trading instrument (currency pair, commodity, stock index, etc) during any trading session. In addition, it utilizes one of the most preferred technical indicators, the Bollinger Bands. For a detailed overview of this indicator, you can read the article in our Forex Academy.
The time frame is set to 1-minute, while the Bollinger Bands should be set to default (the middle band is a 20-day Exponential Moving Average, while the upper and lower bands represent two standard deviations from that average). The expiry time is 5 minutes.
Buying a Call Option
In order to buy a call option, a trader needs to spot oversold conditions. In case the price of the trading instrument has broken below the lower band, a trader may anticipate a touch and a return within the two bands. Once this occurs and the trader has a confirmation of the move to the upside, he/she may place a buy order. The trader may use candlestick reversal patterns as confirmation.
Buying a Put Option
In order to buy a put option, a trader needs to spot overbought conditions. In case the price of the trading instrument has broken above the upper band, a trader may anticipate a touch and a return within the two bands. Once this occurs and the trader has a confirmation of the move to the downside, he/she may place a buy order. Again, candlestick reversal formations could be appropriate confirmation tools.
Some traders may prefer to use the Average Directional Index (ADX) in order to delimit the area of trading. Therefore, they will look for the ADX to be at or to fall below its 20.0 level.

On the 60-second chart of NZD/USD above the small triangles indicate spots where call and put options (3 puts, 1 call) can be bought respectively, while taking into account the conditions mentioned.