For this strategy we again focus our attention on the tools the Ichimoku Kinko Hyo indicator offers. By taking advantage of the default settings, we will highlight the Senkou Span A and Senkou Span B lines, which form the Ichimoku cloud. They serve as support and resistance lines. For a detailed overview of the Ichimoku, you can check this article out.
Trading signals are generated when the price of the trading instrument breaks one of the boundaries of the cloud. For this strategy one may use time frames such as 1 hour, while the option expiry time may be set to the end of the session he/she is trading (Asian, European or American).
- Trade Forex
- Trade Crypto
- Trade Stocks
- Regulation: NFA
- Leverage: Day Margin
- Min Deposit: $100
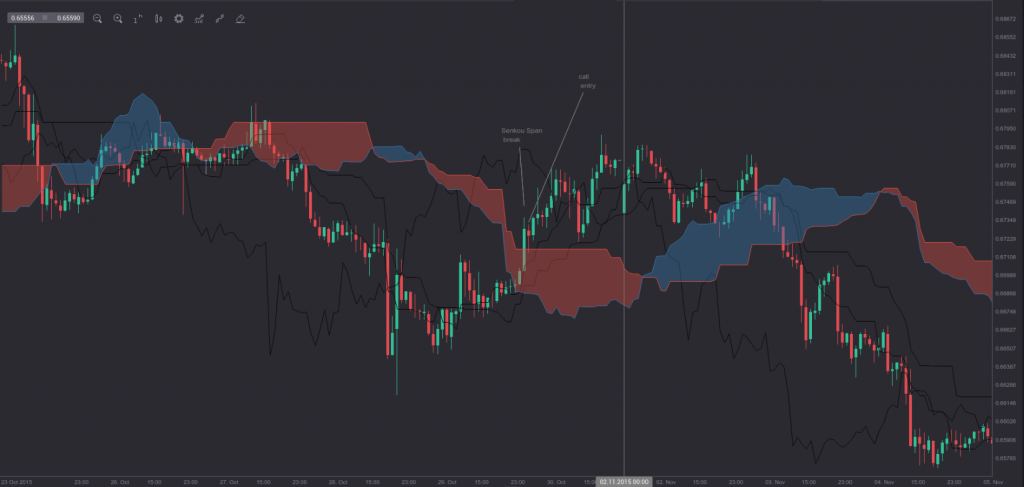
In order to buy a call option, a trader needs to detect where price action breaks and closes above the upper boundary of the Ichimoku cloud. Immediately after that, he/she may make his/her entry. The chart below visualizes the breaching of the Senkou Span, the call entry and the option expiry (vertical line).
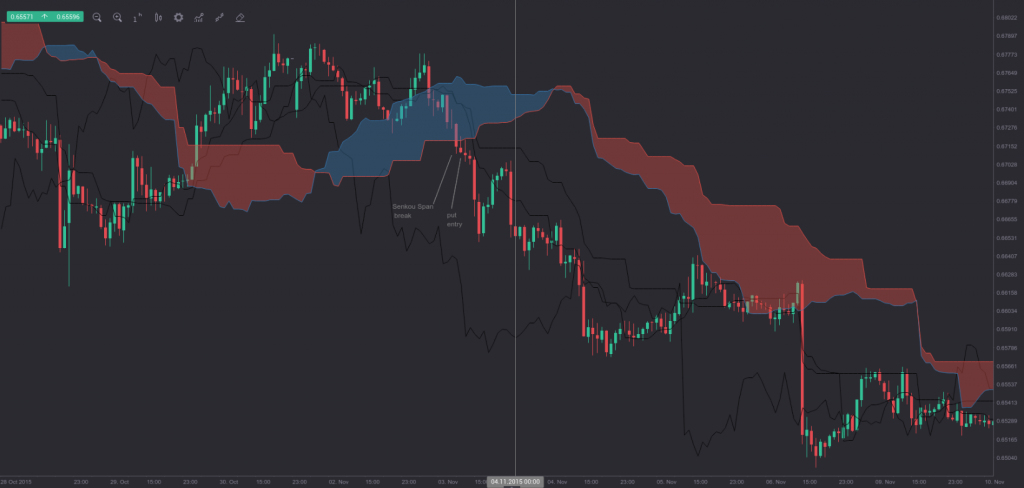
In order to buy a put option, a trader needs to detect where price action breaks and closes below the lower boundary of the Ichimoku cloud. Immediately after that, he/she may make his/her entry. The chart below visualizes the breaching of the Senkou Span, the put entry and the option expiry (vertical line).
A word of advice – one should not attempt to trade when the price is moving inside the cloud. He/she should wait for the breakout instead.


