Binary options trading does not encompass short periods of time only. If one feels comfortable not to follow price development minute by minute, but one-two times per day instead, then medium-term and even long-term trading may suit his/her preferences. By examining chart timeframes such as 4-hour or 1-day, he/she may take advantage of option expiry times such as 1 week or longer, for instance. The best trading conditions for such a strategy include a discernible medium-term trend, while a number of exponential moving averages is all one needs to employ as indicators. A detailed overview of exponential moving averages is available here.
For this strategy we will utilize a short-term EMA (4 periods, white in color), a medium-term EMA (8 periods, blue) and a long-term EMA (40 periods, yellow). The longest EMA could be used in order to identify the direction of the trend. In case price action occurs below the 40-day EMA on the 1-day chart, the market is in a bear trend. In case the price remains above the 40-day EMA, the market is in a bull trend.
To make a trading decision, we need to detect an occurrence, known as the ”perfect order” of the moving averages, or simply the specific way they appear on the chart.
In order to buy a put option, we need to look for the following conditions:
1. The 40-day EMA should be positioned on top of all moving averages and the 4-day EMA should be at the bottom,
2. The moment when the 4-day EMA crosses the 8-day EMA in a top-down manner is our signal to act.
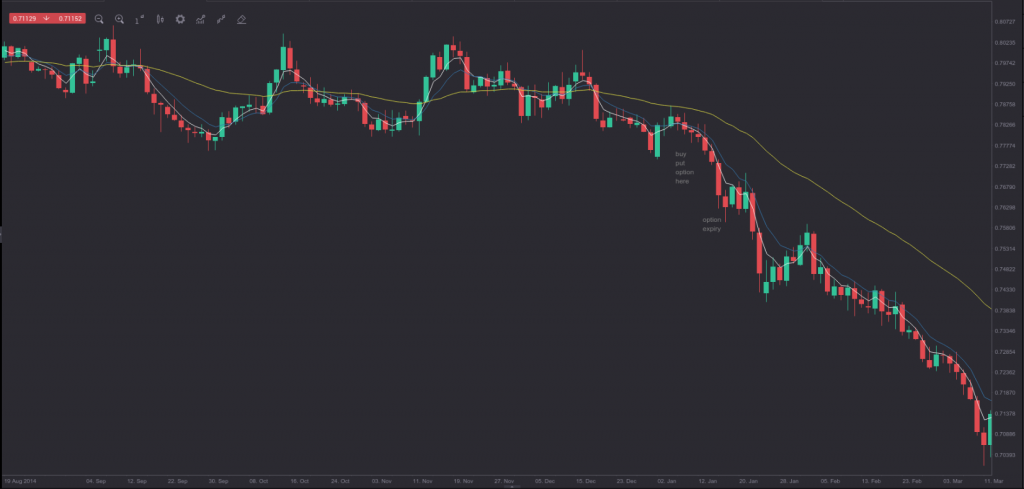
On the chart below, we see that a bear trend has begun in late December and the three EMAs appeared in the order we are looking for. On January 7th the 4-day EMA crossed the 8-day EMA in a top-down manner, while on January 8th we could make our move – to buy a put option with an expiry time of 1 week (January 15th in this case).
In order to buy a call option, we need to look for the following conditions:
1. The 40-day EMA should be positioned at the bottom, while the 4-day EMA should be on top of all moving averages,
2. The moment when the 4-day EMA crosses the 8-day EMA in a bottom-up manner is our signal to act.
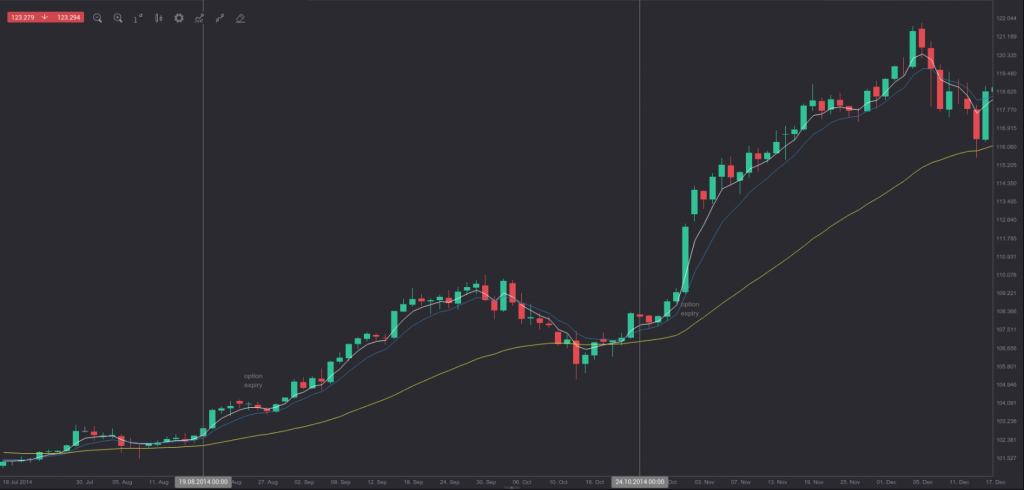
On the chart below, we see that a bull trend has begun in late July and the three EMAs appeared in their perfect order. On August 18th the 4-day EMA crossed the 8-day EMA in a bottom-up manner, while on August 19th we are able to take action – to buy a call option with an expiry time of 1 week (August 26th in this case). Another call entry opportunity occurred on October 24th, after a day earlier the perfect order of the moving averages formed. The option expiry in the second case is on October 31st.

