Here you will learn how to trade binary options by using candlesticks charts. Trading binary options is classified as gambling by many countries, but the truth is that trading binary options rarely involves luck. With the help of technical and fundamental analysis, you can accurately predict how an asset’s price will change in the near future. One of the easiest ways to perform technical analysis is to use candlesticks.
In this post I’ll talk about candlestick trade analysis and how It can help you make more money from trading binary options. Candlesticks have been used for many years and at the moment they are one of the most popular ways to analyze the market and to recognize trade signals. Candlesticks are used in all traditional markets, so they can also be used in the binary options market. Most traders prefer using this type of analysis when they are trading the Touch/No
- Trade Forex
- Trade Crypto
- Trade Stocks
- Regulation: NFA
- Leverage: Day Margin
- Min Deposit: $100
Touch or Call/Put trade types
Candlesticks can form different patterns that show the trader what is going to happen next. There are two main types of patterns – reversal and continuation.
Call/Put
When using the Call/Put trading option, the trader says that the asset’s price will either go up or down until the expiration time comes. With the help of candlesticks it will be fairly easy to decipher the price’s next move, so keep on reading to find out how to do this. The most suitable pattern you can use in this case is the reversal one. The main reason for this is that these patterns have a reliability index which makes them more reliable and accurate.
- Trade Forex
- Trade Crypto
- Trade Stocks
- Regulation: NFA
- Leverage: Day Margin
- Min Deposit: $100
So, let’s get to the point and tell you how you can use a candlestick pattern to successfully trade binary options:
1. Open the charts that you are planning to use and look for any candlestick patterns that look reliable. If you don’t know to access these charts, then you need to download the MT4 platform that is supported by a Forex broker who has an asset base that includes the asset you are planning to trade on the binary options market.
2. When you find a chart that contains a promising pattern, then save it and also take a screenshot of the time frame. You’ll need it later to calculate the expiration time
3. Identify the pattern and memorize the direction in which the trade should go. On the image below you can see the candlestick pattern I spotted when I took a look at the charts that come with the crude oil asset. The candlestick pattern in this case ss called bearish harami and it shows that the asset is most likely bearish, so its price should keep going down.
4. Keep in mind that spotting the pattern isn’t enough to guarantee you a profitable trade. You need to get the expiration time right as well, so keep a close an eye on the time frame and determine the best settings for your situation. Unfortunately, there isn’t a sure-fire way to get the right expiration time, but when you trade for a couple of months you’ll know how quickly or slowly a price can move.
Touch/No Touch
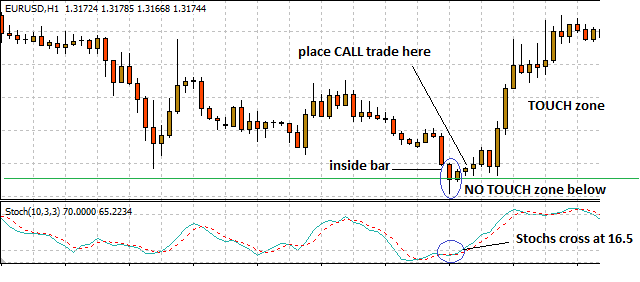
Reading candlestick patterns when you want to open a Touch/No Touch trade is pretty similar to the method used for Call/Put trades. However, in this case the Touch strike price should follow the direction of the reversal pattern, while the No Touch strike price must stay above the high points of the candlesticks that are included in the reversal pattern. See the image below:

As you can see, understanding candlestick patterns isn’t so difficult, but you’ll need to test the things you learned today in order to get them to work properly.
