Short-term momentum trading
This lesson will cover the following
- A quick overview
- Steps a trader needs to follow for this strategy
There are traders who lack the patience to wait more than a day for a trade to develop. They favour situations in which price moves immediately and a trade becomes profitable within the next few minutes; otherwise, they simply close the position. These traders prefer to take 20-pip profits ten times during the day rather than make a 120-pip profit on a single trade while watching the market first move, say, 70 pips against them.
A suitable approach for such people is the so-called short-term momentum strategy. The general idea is to enter long or short only when momentum is on one’s side. In this way, the trader aims to reach his or her first profit target as soon as possible. The following indicators can be used with this approach: the 20-day Exponential Moving Average (EMA), the 100-day Simple Moving Average (SMA) and the Moving Average Convergence Divergence (MACD). For the MACD histogram use a short-term EMA period of 12, a long-term EMA period of 26, a signal EMA period of 9 and closing prices. A trader should enter only when the MACD has turned within the last five candles. This is because the entry needs to be exactly when momentum is starting to build, not when it has already amassed.
- Trade Forex
- Trade Crypto
- Trade Stocks
- Regulation: NFA
- Leverage: Day Margin
- Min Deposit: $100
What does a trader need to do?
Now let us discuss the steps a trader should follow to implement this strategy.
When going long:
the trader should identify a currency pair trading below both the 20-day EMA and the 100-day SMA;
the trader waits for the price to cross above both moving averages by at least 15 pips, while ensuring that the MACD turned positive no more than five candles earlier;
the trader places a market order to buy and sets a protective stop at the low of the candle that breached the moving averages;
the trader sells 50% of the position when the market moves in his or her favour by the amount put at risk. At the same time, the stop on the remainder of the position is moved to break-even;
Fifth, the trader moves the stop on the remainder of the position to the 20-day EMA minus 15 pips.
When going short:
the trader should identify a currency pair trading above both the 20-day EMA and the 100-day SMA;
the trader waits for the price to cross below both moving averages by at least 15 pips, while ensuring that the MACD turned negative no more than five candles earlier;
the trader places a market order to sell and sets a protective stop at the high of the candle that breached the moving averages;
the trader buys back 50% of the position when the market moves in his or her favour by the amount put at risk. At the same time, the stop on the remainder of the position is moved to break-even;
the trader moves the stop on the remainder of the position to the 20-day EMA plus 15 pips.
Example
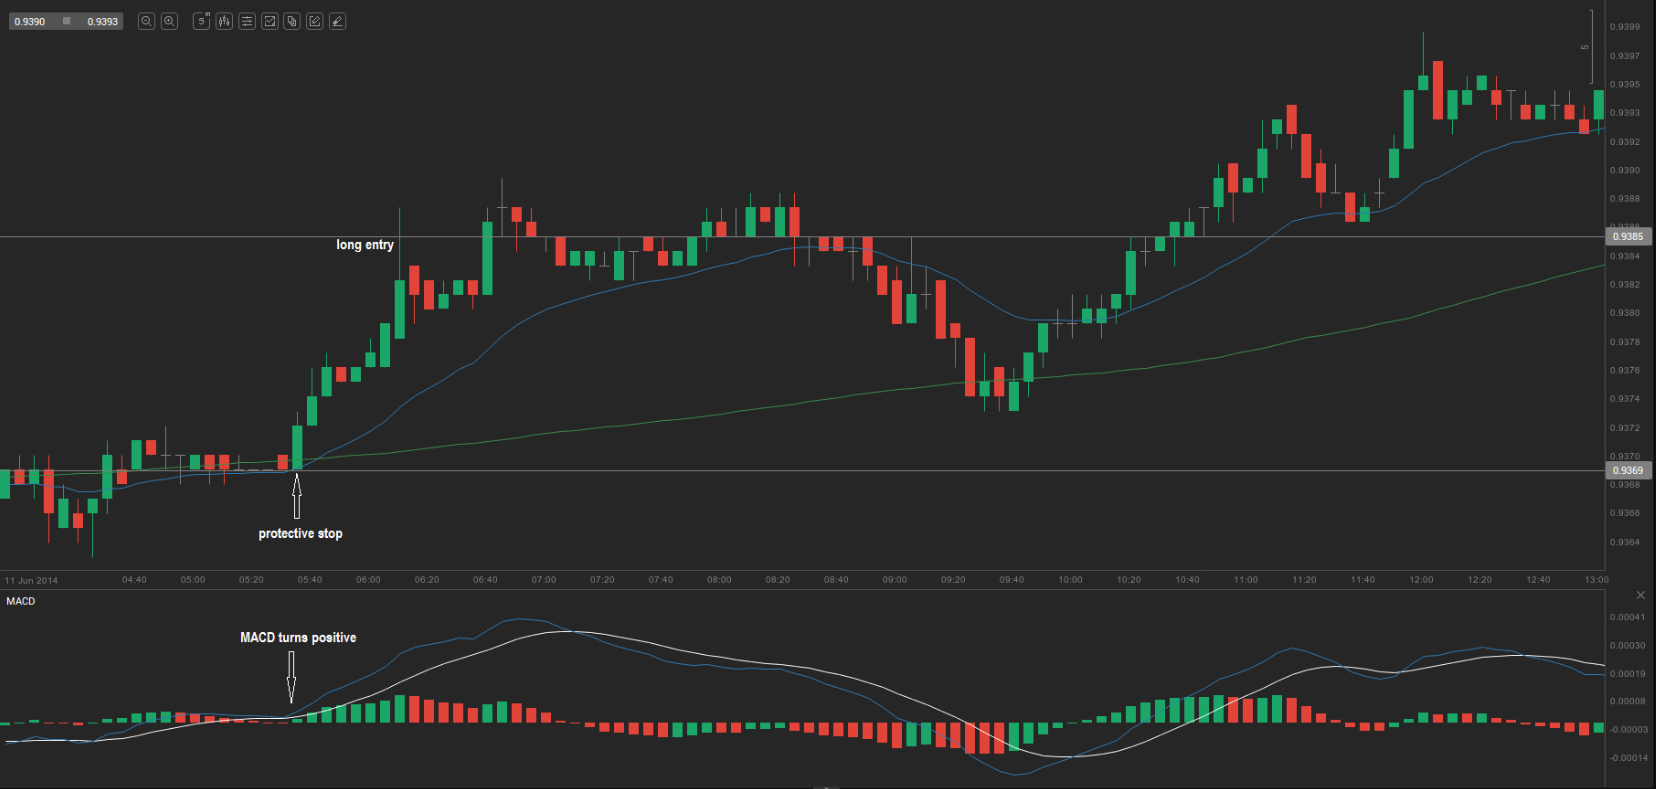
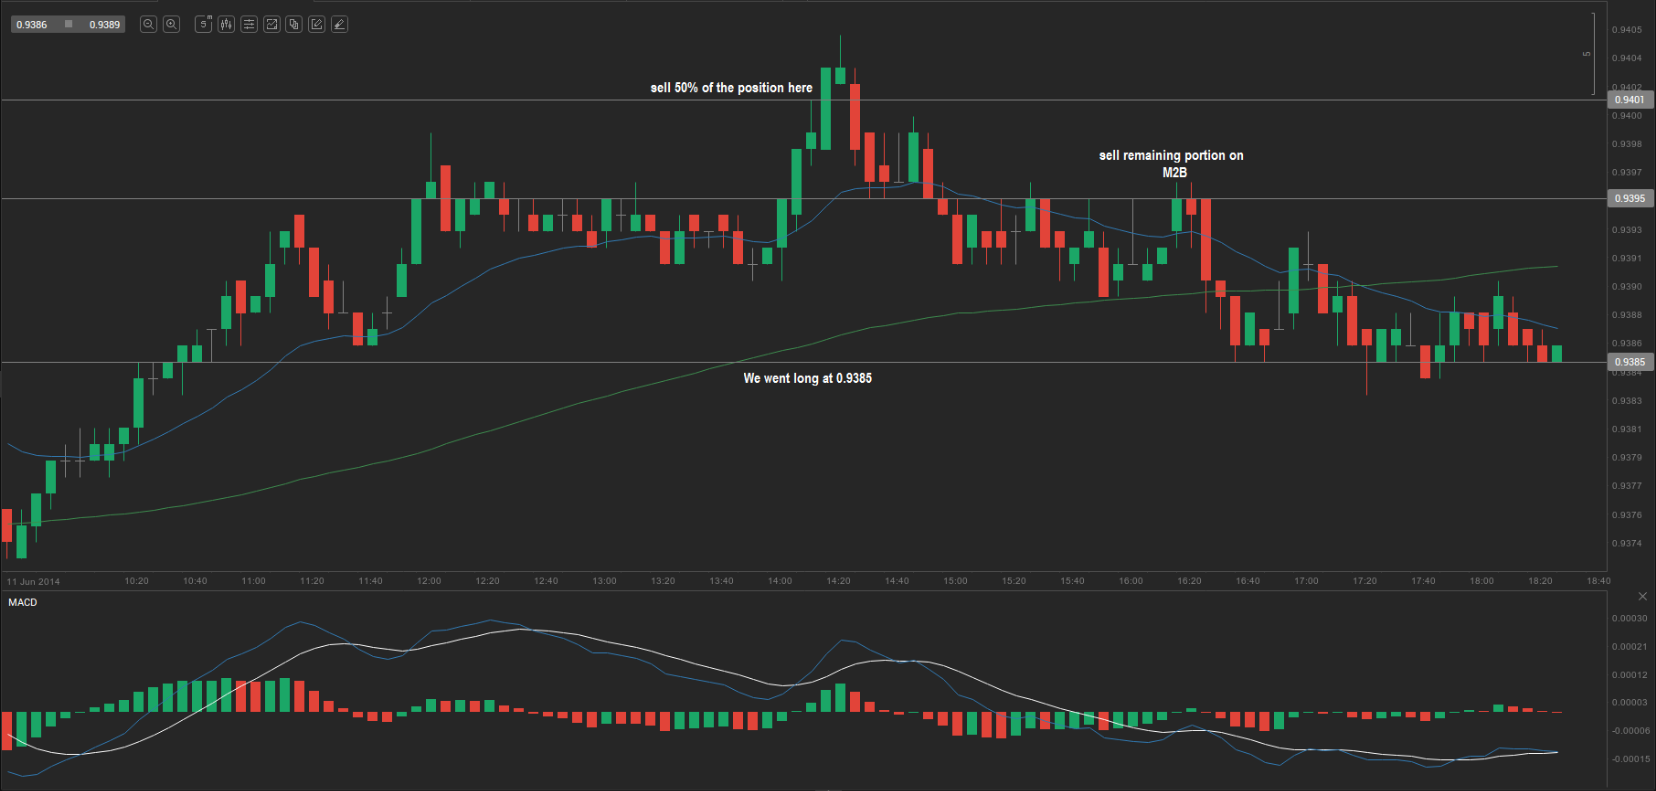
Let us take a look at the 5-minute chart of AUD/USD. On 11 June the pair broke above both the 20-day EMA and the 100-day SMA after a period of consolidation during the Asian session. The MACD had just entered positive territory, and we expected a break above both moving averages of at least 15 pips in order to enter long. The EMA and SMA crossed at 0.9370, so we went long at 0.9385. We placed the protective stop at the low of the candle that broke above the moving averages, namely 0.9369. Our first profit target equals the entry price plus the amount risked. We entered at 0.9385 and set the stop at 0.9369, so the risk was 16 pips. Our first profit target was 0.9385 plus 16 pips, or 0.9401. This target was reached later in the day, so we sold 50% of the position and moved the stop on the remainder to break-even. Later the price fell below the 20-day EMA, but only by a few pips. Because the market began to move against us and we were unable to trail our stop to the 20-day EMA minus 15 pips, we decided to close the remaining portion of the position and capture a further 10 pips at 0.9395. We did so using a fairly good M2B setup. The total profit on the entire position, assuming two lots, was 26 pips, or an average of 13 pips.


