Chandes Momentum Oscillator
This lesson will cover the following
- Definition
- Interpretation
Developed by Tushar Chande, the Chande Momentum Oscillator is used to gauge “pure momentum”. It bears similarities to other momentum indicators such as the Stochastic, Rate of Change and the Relative Strength Index, but other unique features render it a handy tool in the traders handset.
The CMO directly measures momentum as it uses data from both bullish and bearish days in the numerator. Unsmoothed data is used to reveal hidden short-term fluctuations, but smoothing can be additionally applied. Unlike most other oscillators which range in a scale between 0 and 100, the CMOs values are bound between 100 and -100, with overbought and oversold levels typically considered above 50 and below -50, respectively.
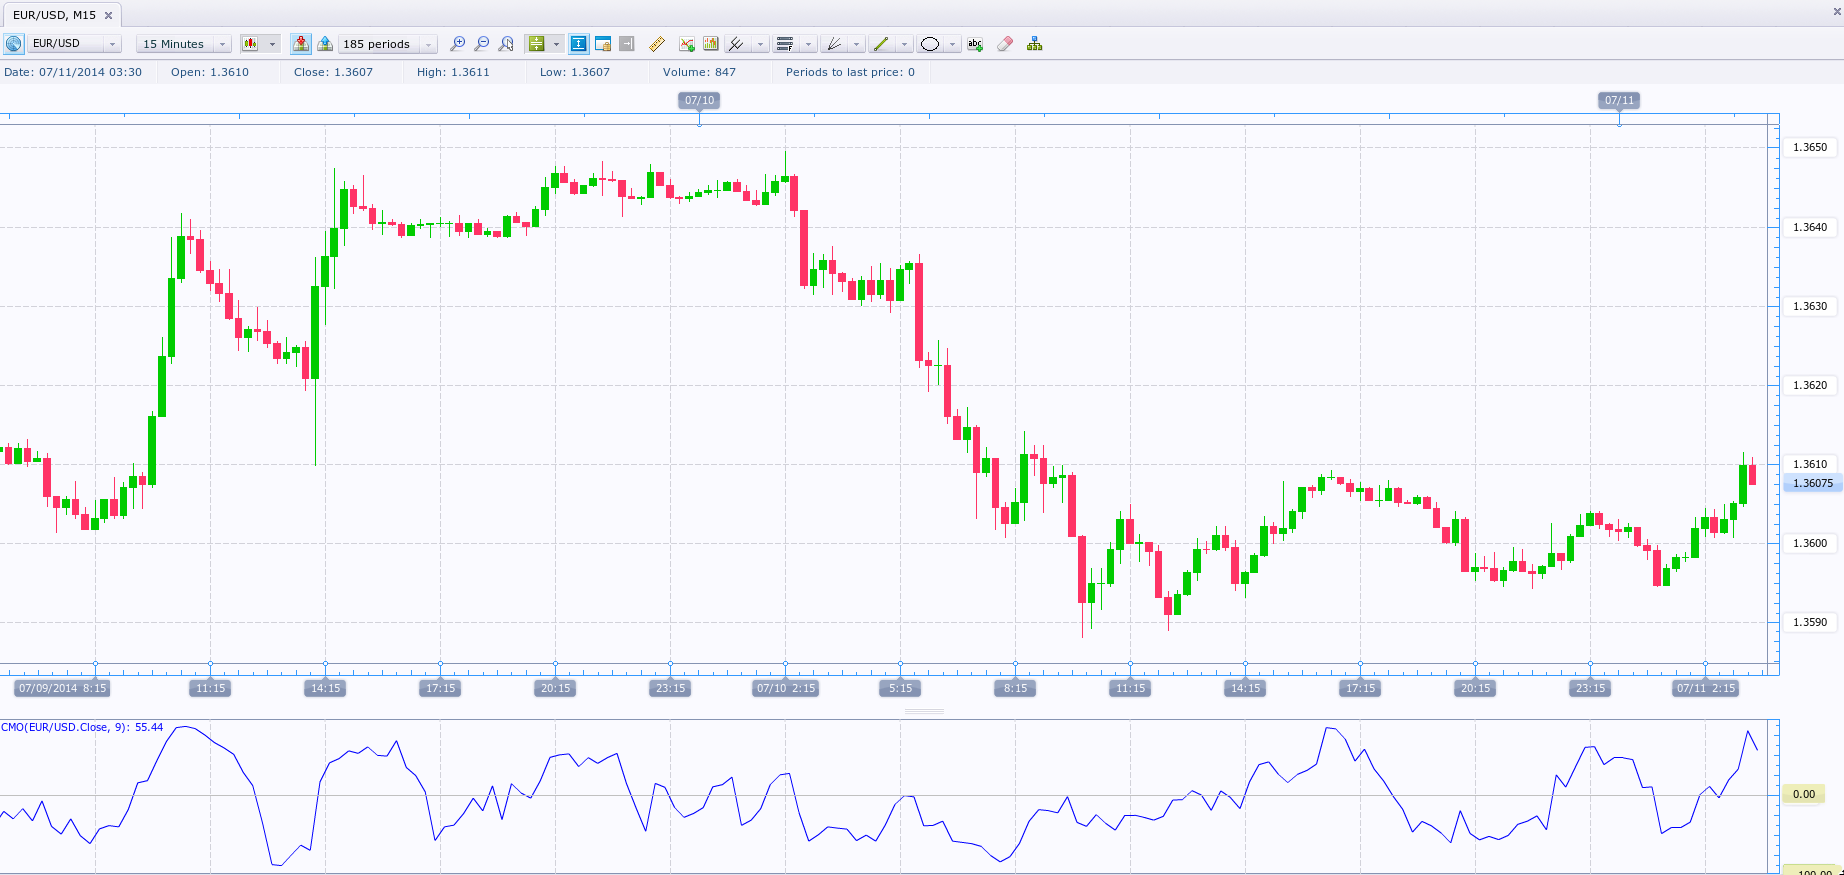
Thus, like other oscillators, the Chande Momentum Oscillators main goal is to identify overbought and oversold levels, which tend to precede price reversals and thus generate entry signals. The screenshot below shows the indicators visualization in a trading platform.
However, the CMOs application is not limited only to momentum reversal predictions. It measures the trend a currency, commodity or stock is exhibiting – the further away its value is from the zero level, the stronger the bull/bear trend is. Conversely, as the indicator hovers near the middle of the scale, it implies that the market is trading sideways (range-bound).
Additionally, the CMO can be used to generate entry signals, apart from crossing the overbought/oversold areas, by adding a moving average in the indicator. As the indicators line crosses the moving average from below and edges higher, this generates a buy signal and vice versa.
Like other momentum indicators, Chandes Momentum Oscillator can also be traded on the basis of divergences with the price action. This is done in a similar way like trading divergences with the Relative Strength Index, Stochastic Oscillator and so on.
