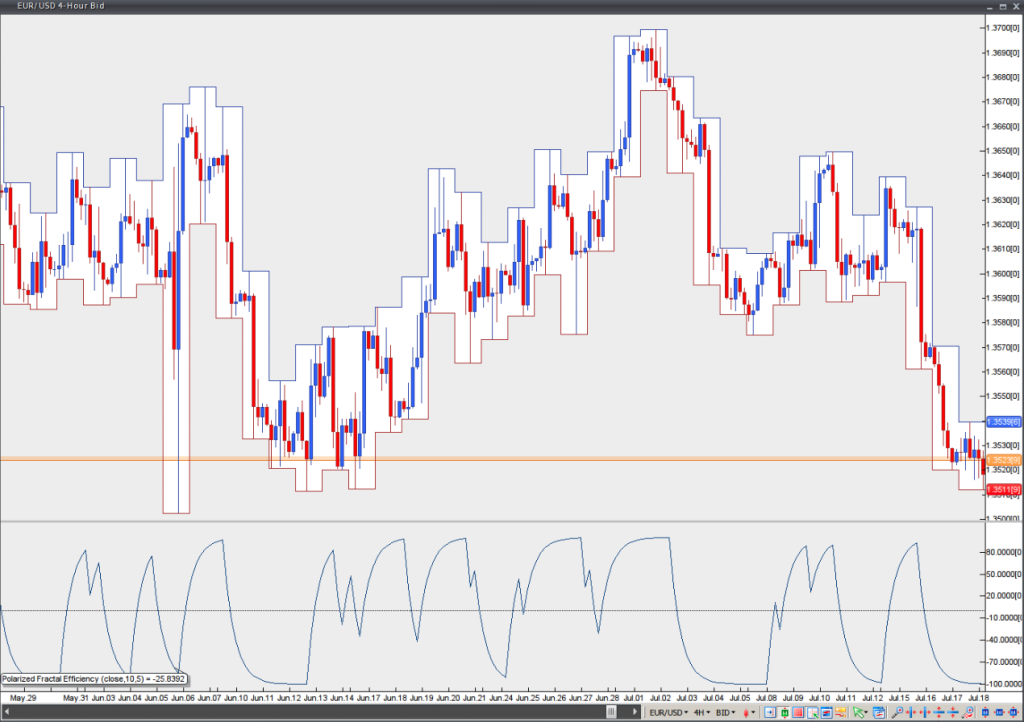
Polarized Fractal Efficiency
This lesson will cover the following
- Explanation and calculation
- How to interpret this indicator
- Trading signals, generated by the indicator
Developed by Hans Hannula, the Polarized Fractal Efficiency (PFE) indicator was described in the January 1994 issue of Technical Analysis of Stocks & Commodities magazine. The PFE generally indicates how trendy or overloaded a market is. In case the PFE reading is below zero, this suggests there is a bear trend. In case the PFE reading is above zero, this suggests there is a bull trend. The higher the value, the more efficient, ”trendier” the movement to the upside is. If the PFE reading is in proximity to zero, this means that market movement is choppy and less efficient.
Usually a trader will enter at maximum efficiency (a level where the PFE appears to have reached a maximum in one direction or the other. The trader needs to keep his/her position active all the way to the other extreme level. However, an exception is a case, when the PFE slows down at levels close to zero – he/she needs to exit the trade and wait for another entry at ”maximum efficiency” level.
